How to Create the Perfect PR Report
PR reports are created by nearly all PR professionals. There are numerous standards that often vary significantly even within an agency or company. Wouldn't it make more sense to create a unified, as automated as possible process to achieve maximum efficiency in PR report creation? A survey of over 1,000 communicators showed one thing in particular: creating clipping reports is no fun and takes a lot of time. Moreover, you surely want to stand out from your competitors, offer your clients the best service, and continuously impress them with the success of your work.
What Could Such a Process Look Like? Where Is the Potential for Digitalization?
1. Define Requirements
At the start of working with your clients or before creating your next report, you should first ask about their requirements for a PR report. This allows you to tailor the reporting to provide maximum value to the recipients. Only then is it worthwhile for you to create such a report. You should clarify various questions with your clients:
Who is the target audience for the PR report?
A clipping report can be directed at various internal and external recipients. Depending on the target audience, the focus of the report will differ, which you should consider when creating it. In most cases, you can base the requirements on the following:
Head of Communications Department: Reach, goal achievement, mentions in target media
Agency Management/Senior PR Manager: How much value could we achieve in what time? How many mentions? How high was our reach?
Upper Management/Executive Board: How many leads were generated? What is the branding and sentiment? Is PR worth the money?
What are the goals of the PR initiative and the report?
If you know what goals the report recipient is pursuing, you can think about how best to measure these goals. This way, you can present only the most important data to clearly show the successes and value of your PR work at a glance.
Additionally, you can jointly determine which KPIs are also important to the recipient. These can be both qualitative and quantitative metrics. You can then capture all the desired KPIs directly when clipping and place them in the report. This way, you always create exactly the overview your client needs.
How often should the PR report be created?
Depending on the frequency, the focus of a PR report is usually different. Here we have briefly listed what these differences might be:
Monthly Report: Check if the results are heading in the desired direction. Reallocate budgets to successful initiatives if necessary. Define new measures if the numbers are not as good.
Quarterly Report: What value does PR generate for the company? Summary of the results and explanation.
Annual Report: Should clearly show the long-term communication strategy and the success of PR work, as these reports often determine the budget. Arguments for additional tools, resources, and campaign budgets can also be included.
Campaign Report: What have you achieved? Was the campaign goal achieved?
Crisis Report: How did PR measures contribute to calming the crisis?
What content is desired?
How should the numbers and clippings be presented in the report? Should media observations be presented in detail with images, or are only the KPIs desired? Is it useful to use diagrams or tables? Tables are very suitable for direct comparisons, and diagrams are good for showing trends over time. In some cases, a brief written summary of the results (similar to a management summary) is also desired.
2. Collect Clippings
Once all requirements are clarified and you know exactly what to look for, you can finally get to work and collect relevant clippings.
You can either compile and store all your client's clippings or only keep particularly important media observations, so-called highlight clippings. For this, you have the option to use various services. This includes using a media monitor like Landau Media or Observer. Here, you create a search order for your client, and all found clippings are provided to you for a fee. For online and social media clippings, you can also use web services like Google Alert or Mention. These notify you when your client appears on the web or social web. Additionally, you can also search for clippings yourself.
For later analysis of the clippings and report creation, it makes sense to store all found media observations in one place. Software tools like aclipp are particularly helpful here. You can store clippings from all channels and even automatically import results from other tools. This way, everything can be centrally and thus much faster evaluated for the PR report later.

Since PR work is becoming more data-driven and you want to transparently demonstrate the value of your work, you should also store relevant KPIs alongside the image. Researching the numbers is particularly challenging, but there are also service providers you can use for a fee. These include SEMrush or SimilarWeb. Additionally, you can request data directly from the website operator or journalist and use the media data. For social media clippings, you can simply read or calculate some metrics. However, note that these can change continuously, so you should update them again before creating a report.
These data are often stored in large Excel spreadsheets and then combined with the images of the clippings in the report. But this can now be done much more efficiently: software tools like aclipp help here. KPIs can be stored together with the media observation centrally to later create PR reports with just a few clicks. Additionally, aclipp takes care of the tedious search for the appropriate metrics, which are automatically added when uploading a clipping.

3. Create the Report
Now you can create the report with PowerPoint, Excel, or Word. Over 50% of the PR managers we surveyed do it this way. Of course, this process can also be automated using software tools like aclipp. With the aclipp report generator, you can create clipping reports with just a few clicks. This way, the process takes a maximum of 4 minutes instead of the average four hours in the DACH region.
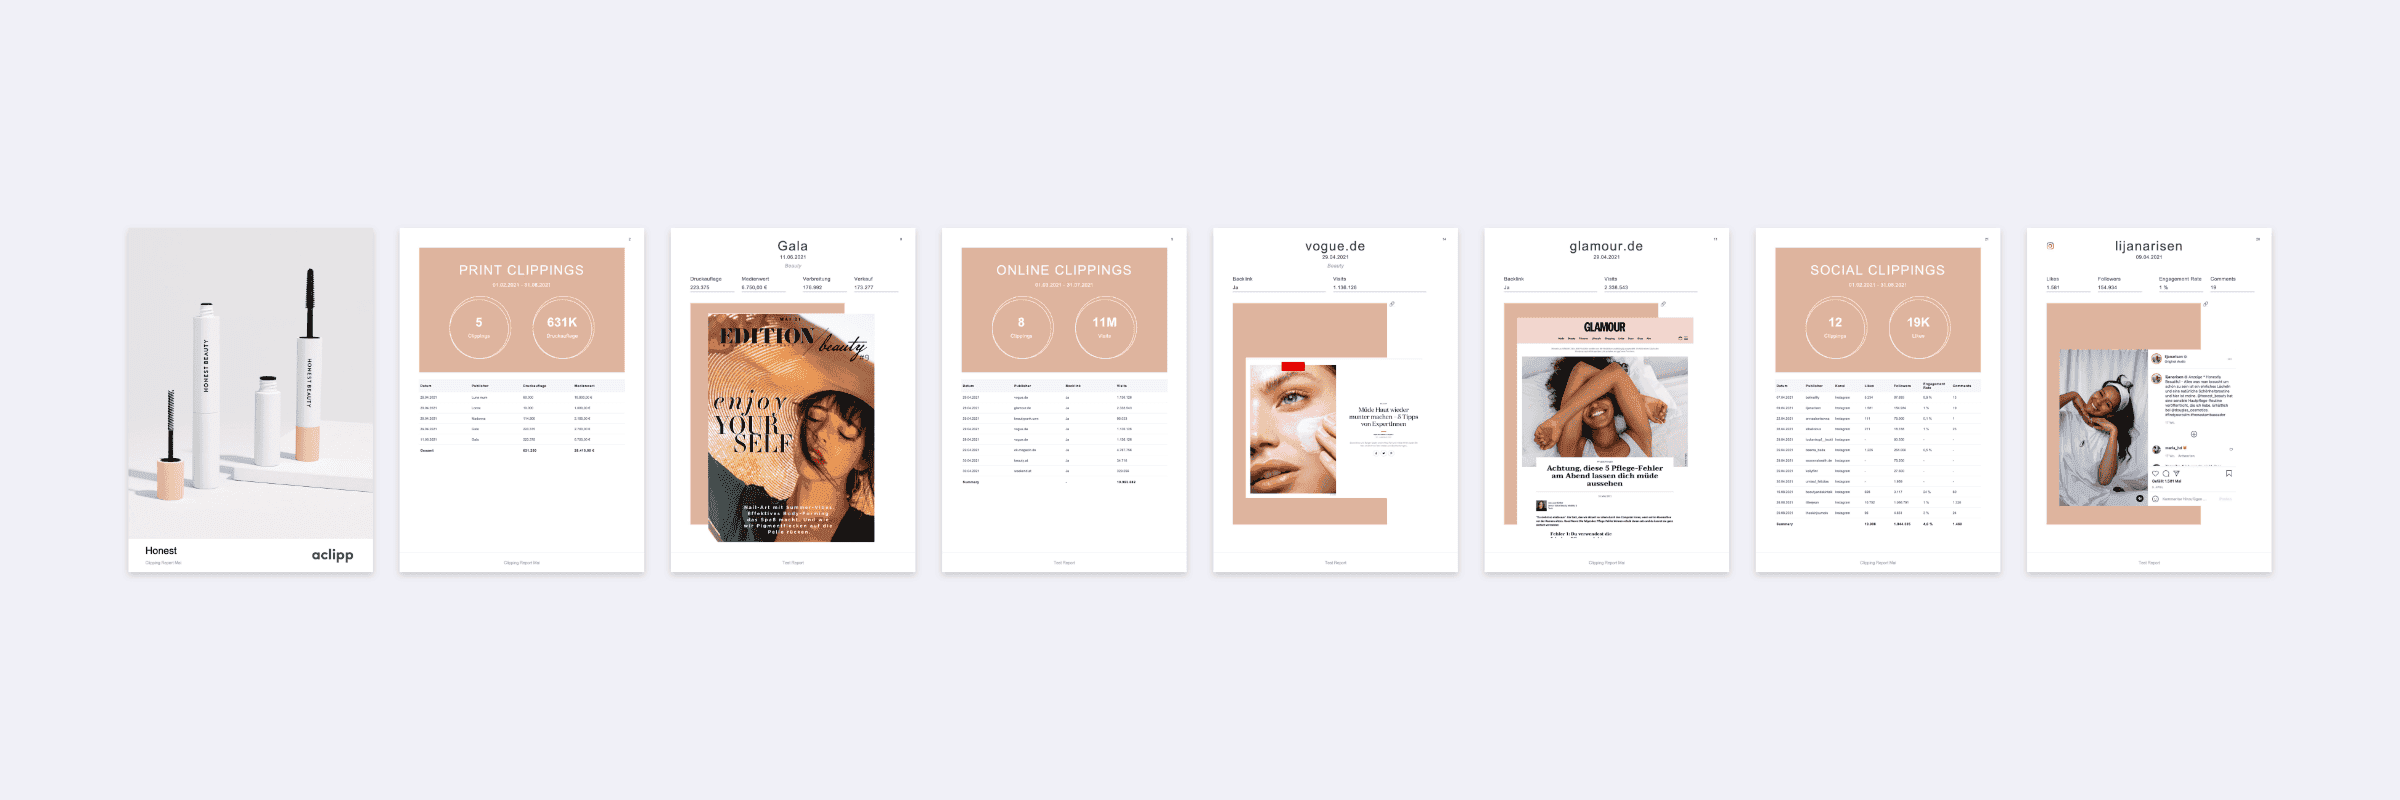
As mentioned earlier, the layout of a clipping report is also important. A well-structured PR report in an appealing design with all the recommended content could look like this:

First, all media observations are summarized in a tabular overview grouped by channel. This gives the recipients a clear overview of the PR impact right from the start. Then all clippings are presented with graphics, publisher, date, various tags, and the recorded KPIs. For online or social media clippings, the link to the original is also provided, allowing recipients to read it in full if necessary.
Diagrams also contribute to more clarity. This way, you can highlight particularly important KPIs and illustrate their development. This is especially useful if you have data over a longer period. Data in graphical form can be better processed and stored by the human brain.
For diagrams, it is also worthwhile to provide a brief interpretation of the results. This way, you can relate the KPIs and explain to the recipient what they mean to avoid misinterpretations.
4. Adjust Measures
Once the PR report is created and sent to the recipients, you should discuss the further course of action with your clients based on the data. You could make suggestions on which measures to take to achieve the communication goals as efficiently as possible. If necessary, the goals must also be adjusted if they have changed on the company side or prove impossible to achieve.
Through this approach, the PR report always offers maximum value for you and the recipient and does not end up unread in a folder. Otherwise, the elaborate creation of it would not be worthwhile. Additionally, you can improve collaboration with your clients this way. PR reports always clearly show how PR contributes to current company success. This reduces the pressure to justify budget allocation and allows you to optimize your PR work based on data.
Can This Be Done Digitally?
Yes, absolutely! With the help of aclipp, you can digitize and automate a large part of the tedious manual work. PR managers in the DACH region spend an average of 4 hours creating PR reports. Collecting clippings and adding KPIs is not even considered. You can make these processes much more efficient and faster with aclipp. How does it work?
In our clipping database, media observations from all channels can be centrally stored. You can add mentions with a few clicks or have them automatically imported by your media observer. Additionally, we have the appropriate data for all your clippings. For print, online, and social media channels, we even add these metrics for you at the push of a button. You can record all metrics that are relevant to your clients.
Once all clippings are found and supplemented with relevant KPIs by aclipp, you can create a relevant PR report in appealing design within just 4 minutes. Our report generator guides you step by step through the creation process, so you can always customize the report to your client's wishes. Everything that makes for good reporting is always included. So you no longer have to worry about that.
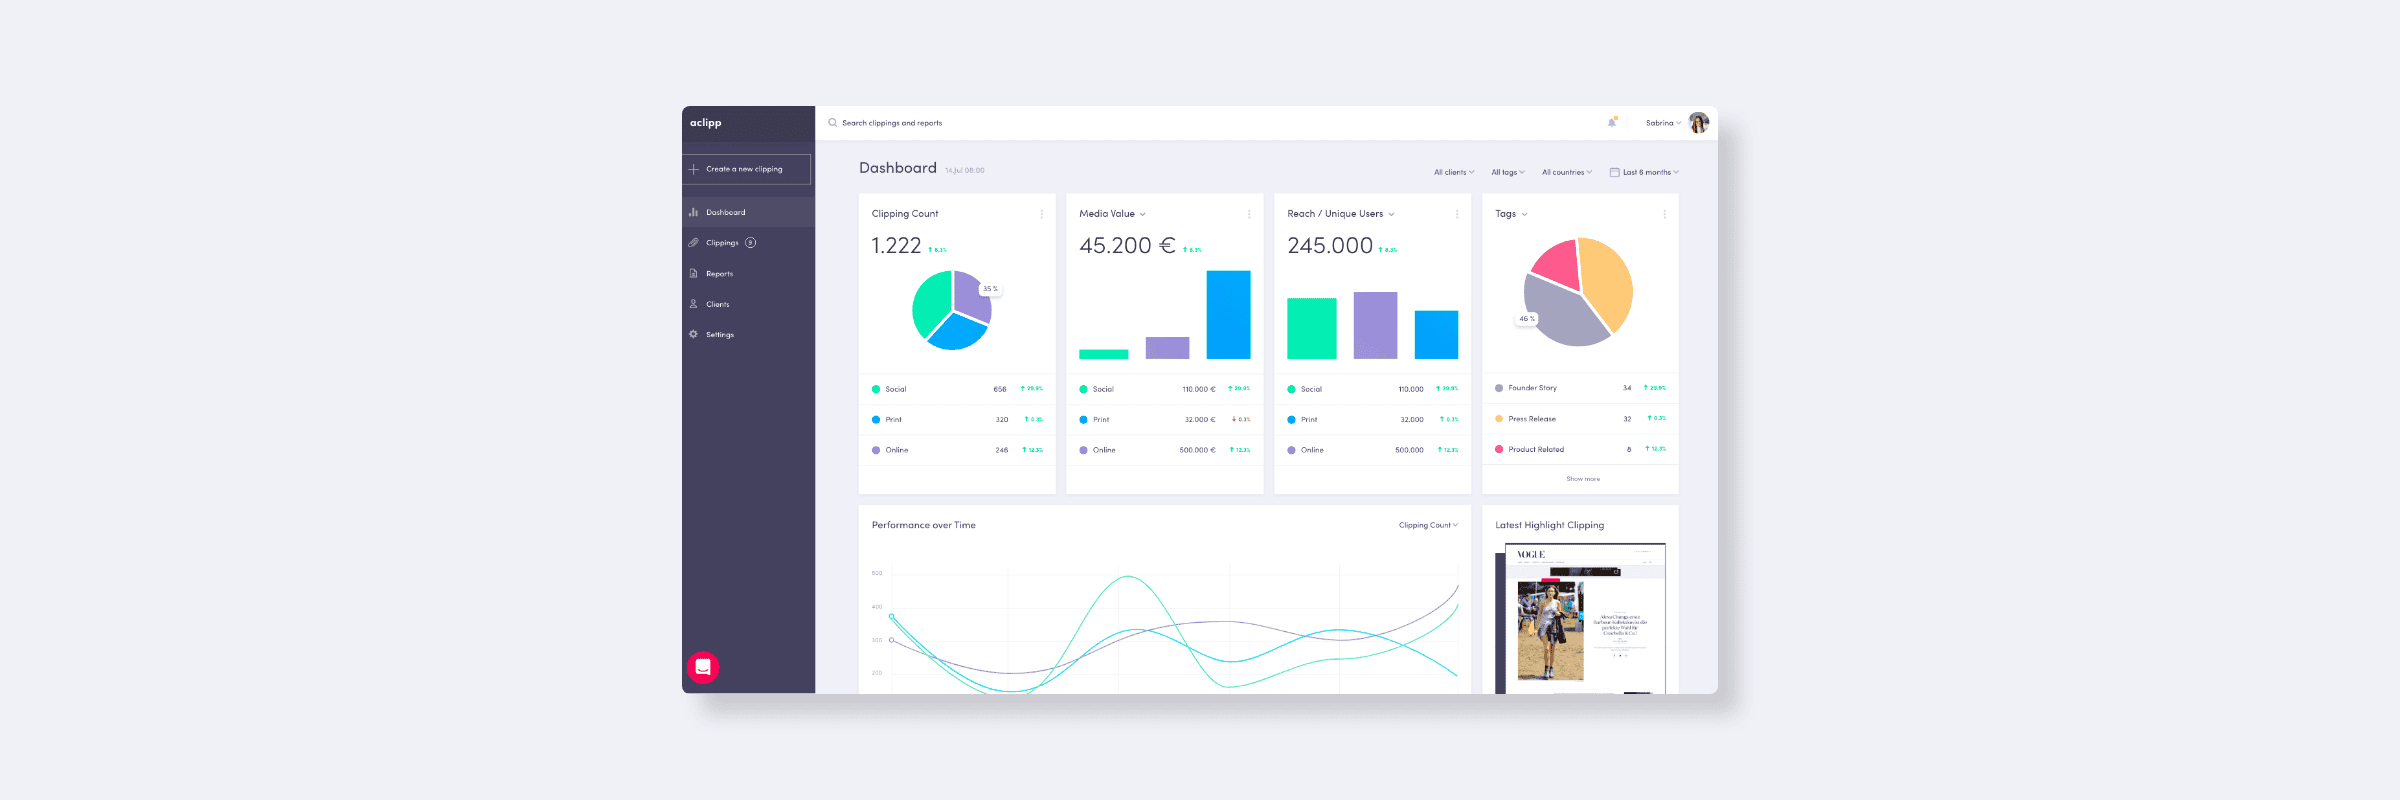
How about always keeping an eye on the success of your PR work? No problem with our dashboard! Here, all important KPIs are clearly displayed. So you always know exactly how successful your work is and how close you are to your goals.


Sarah Amler
Digital Process & Marketing Manager
Sarah was responsible for performance marketing, social media activities and digital onboarding in our software at aclipp.