The State of
PR Reporting
Conversations with 288 European PR leaders outside the aclipp customer base. Tools, time, automation, KPIs.
At a Glance
Who Responded
Mostly decision-makers who own reporting. Few junior roles.
By Role
By Country
Time Spent on Reporting
Per project / client. Based on 37 respondents.
Where the time goes
Median hours per month
The Tool Landscape
119 tool mentions. 57 respondents named at least one tool.
Most mentioned tools
Tools per respondent
Hours per tool
Median monthly hours among users who reported time
Automation, KPIs, and proving impact
Automation skepticism, blockers, and what leadership expects from KPIs.
At a glance
Is zero-hour reporting via automation realistic?
Where most reporting time goes (perception)
What blocks 100% automated reporting?
KPI depth leadership expects
Do reports drive strategy or budget decisions?
- Data quality blocks automation more than tool silos. Reliable data first, tool orchestration second—not the other way around.
- 60% want client-specific or business-outcome KPIs. Not AVE and reach alone.
- Heavy time still sits in prep. Leaders say analysis matters too.
AI visibility and PR reporting
We are asking European PR teams about GEO and AI search visibility. Results will land here.
- 1.How present is AI visibility (ChatGPT, Perplexity, AI Overviews) on your radar?
- 2.Who should own brand visibility in AI answers? PR, marketing/SEO, or both?
- 3.Do you link press coverage to what LLMs cite about your brand?
- 4.Where should AI visibility sit in leadership reporting? Same PR report, SEO tool only, or not a PR metric yet?
Relevant when leadership asks: Do we show up in ChatGPT? PR is measurable, including in AI answers.
Key Takeaways
The default stack is still Excel + PowerPoint
Specialized tools exist. Most teams still use spreadsheets and slide decks.
Assembly takes 4x longer than analysis
Gathering data and building decks eats the calendar. Interpretation comes second.
36+ hours a year on reporting alone
At 3 hours per month median, reporting costs a full work week per year per project.
Nearly half use no dedicated tool
43% use only general-purpose software. Room for purpose-built reporting is large.
Built to fix exactly this
Manual stacks and messy data slow teams down. aclipp turns coverage into leadership KPIs in one quarterly report.
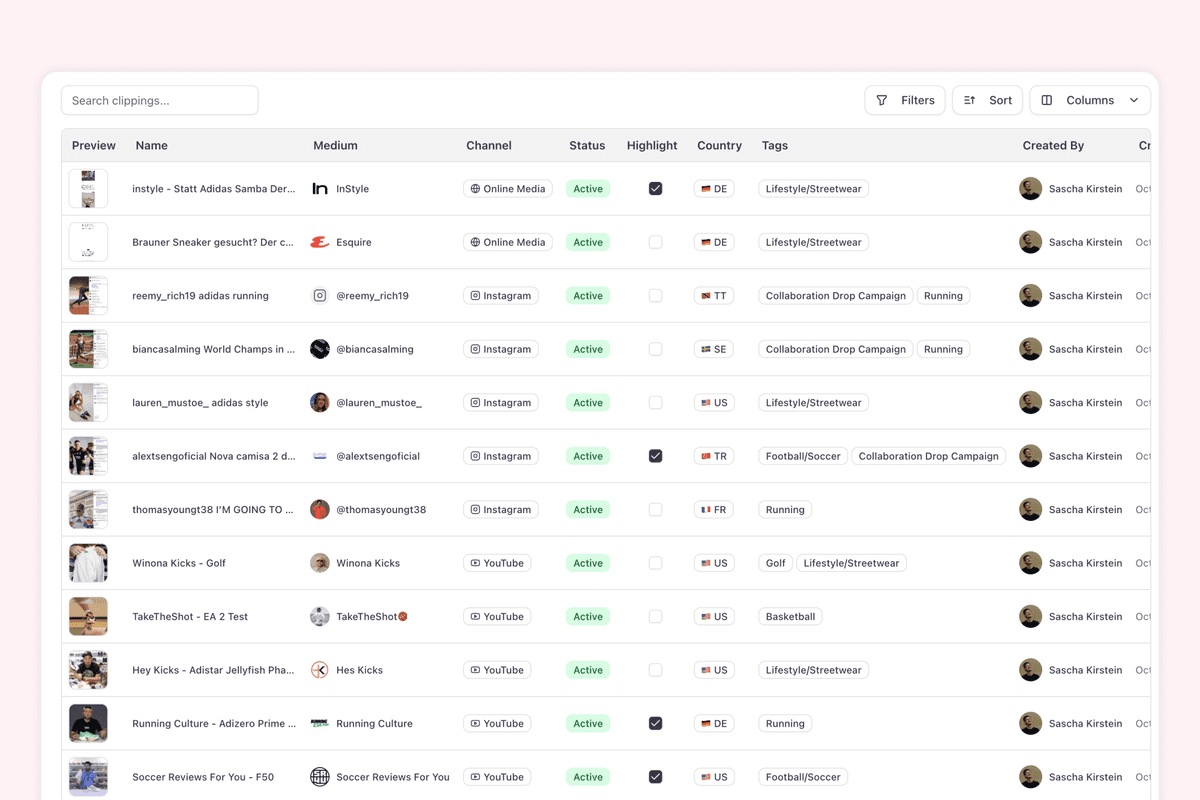
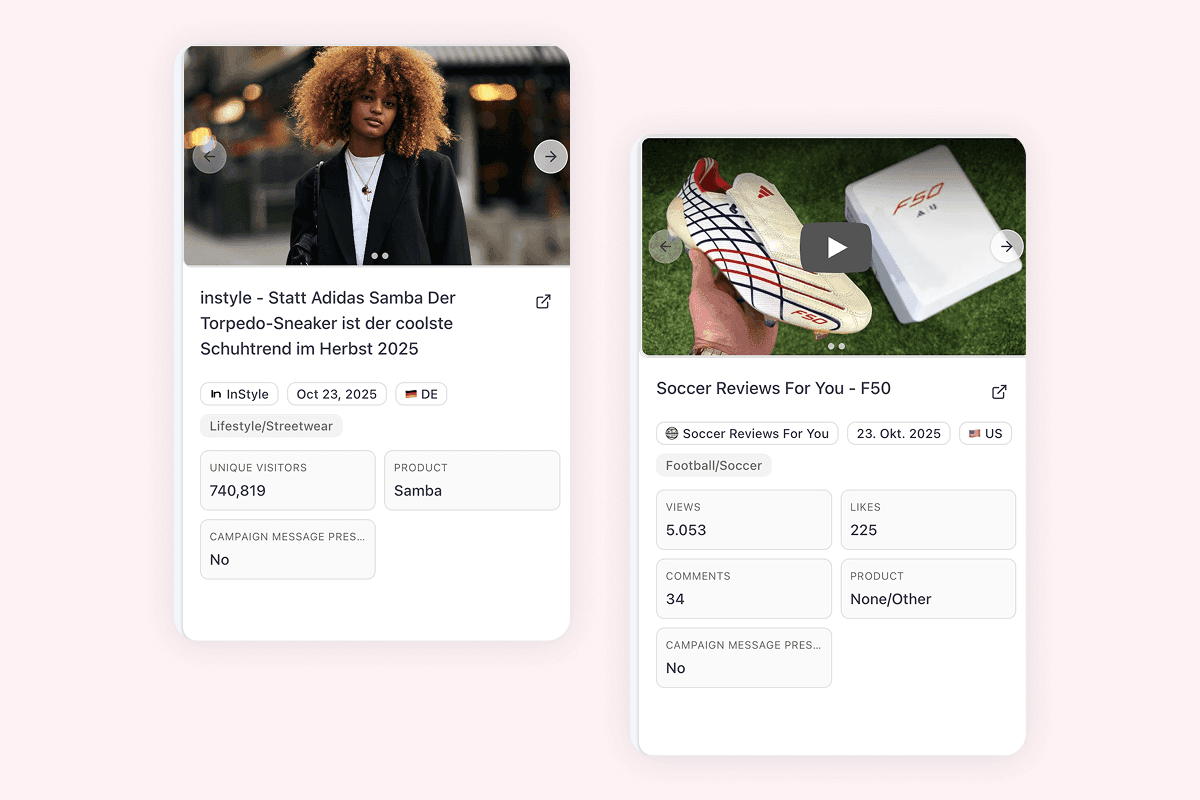
All clippings in one place
Collect clippings from media monitors, RSS, social, and manual uploads in one place.
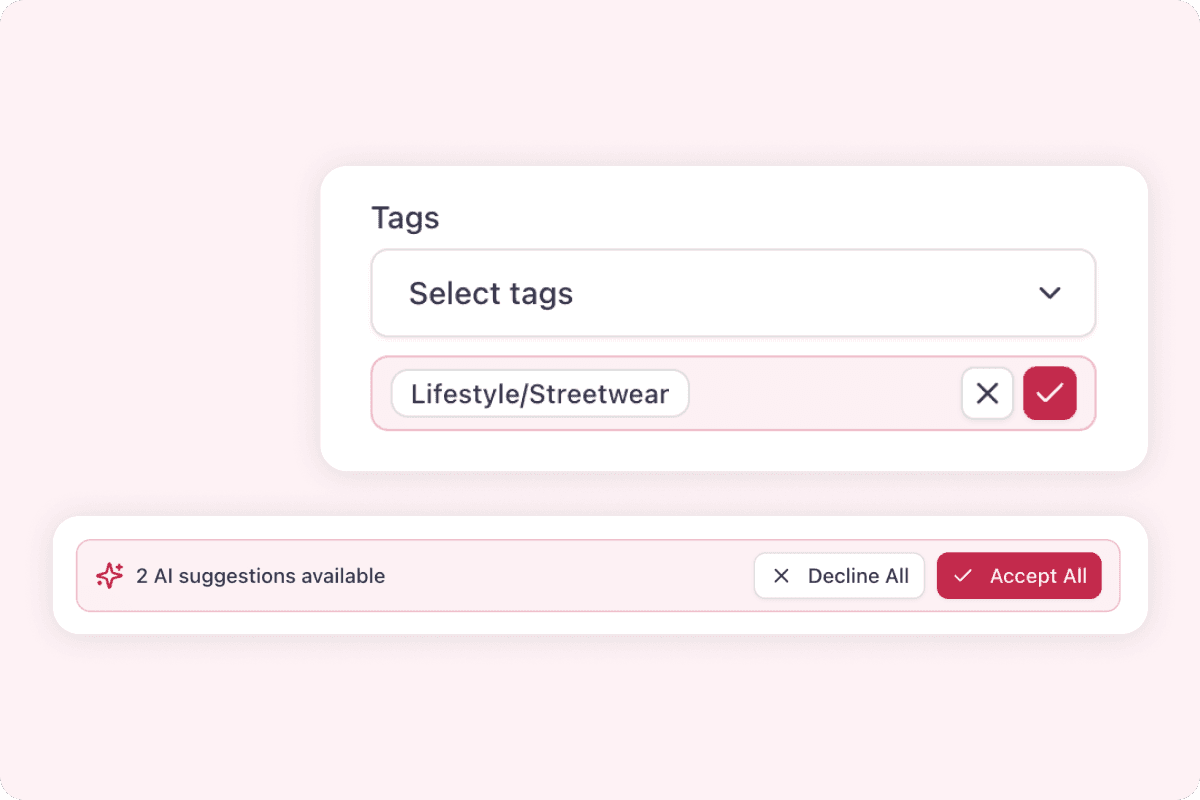
AI fills in the rest
Tags, metrics, sentiment, and summaries filled in automatically and consistently.
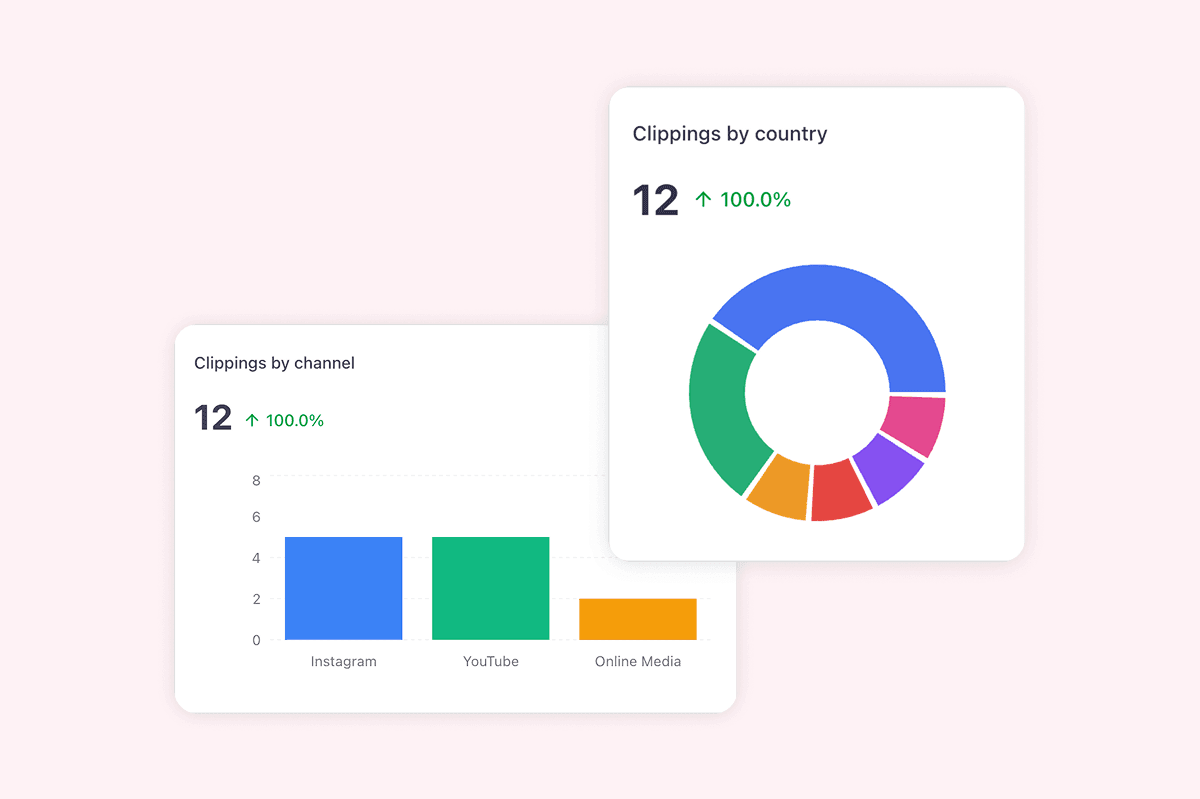
Reports in minutes
Live-linked dashboards and exportable reports that update as your data changes.
Custom KPIs that matter
Define your own metrics and compare across markets, brands, and time periods.