Easy report builder
Select sections, reorder content, and reuse setups.
Create clipping reports, stakeholder updates, and dashboards from the same clippings, tags, metrics, and AI insights.


Choose the sections, KPIs, clippings, and charts you need. aclipp turns live data into stakeholder-ready clipping reports without rebuilding slides by hand.
Try it for freeSelect sections, reorder content, and reuse setups.
Adapt logos, colors, cover pages, and report styling to your brand.
Group by campaigns, tags, markets, outlets, and KPIs.
Share reports as PDFs, live links, or CSV exports.
See how clippings, KPIs, summaries, and branded sections come together for stakeholders.
View example report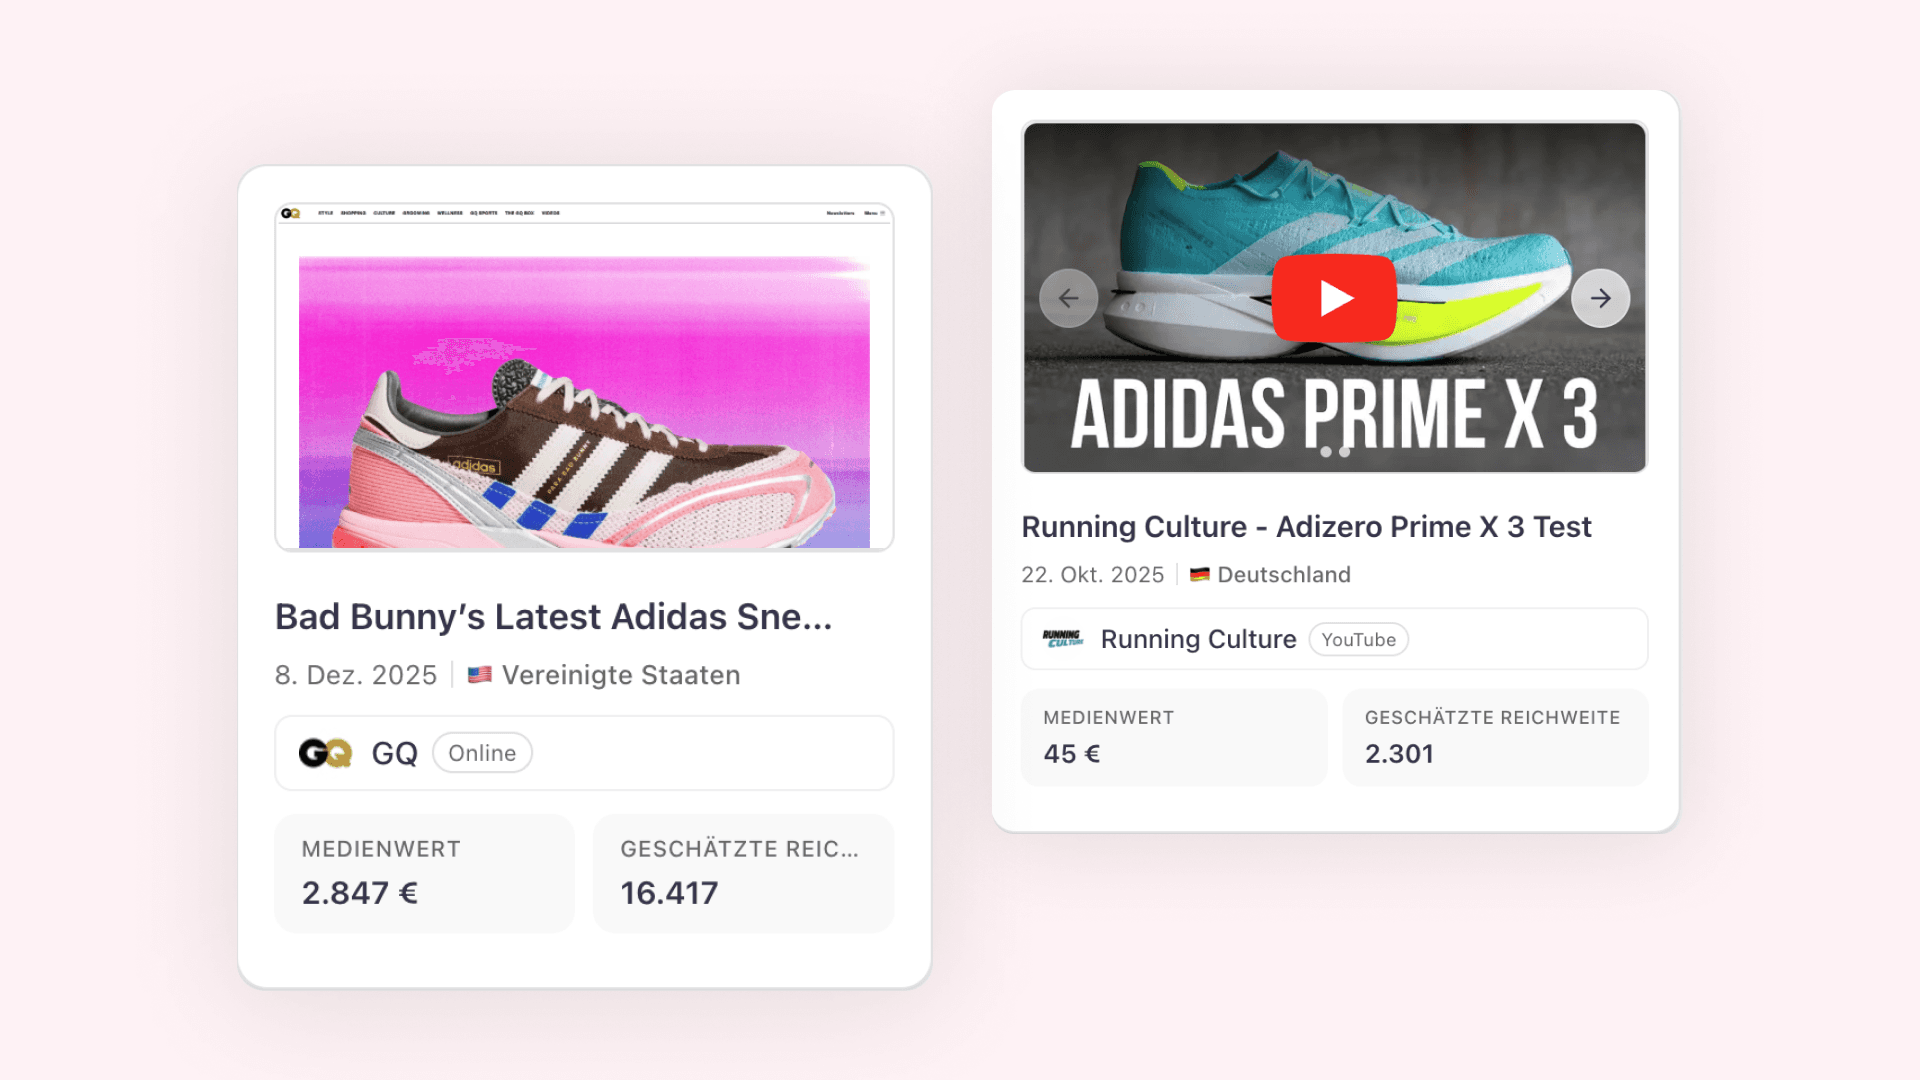
Create live views for campaigns, markets, teams, or customers, then share progress without rebuilding the same analysis every week.
Try it for freeChoose the charts and segments your team uses.
Group data by the fields, tags, and KPIs you define.
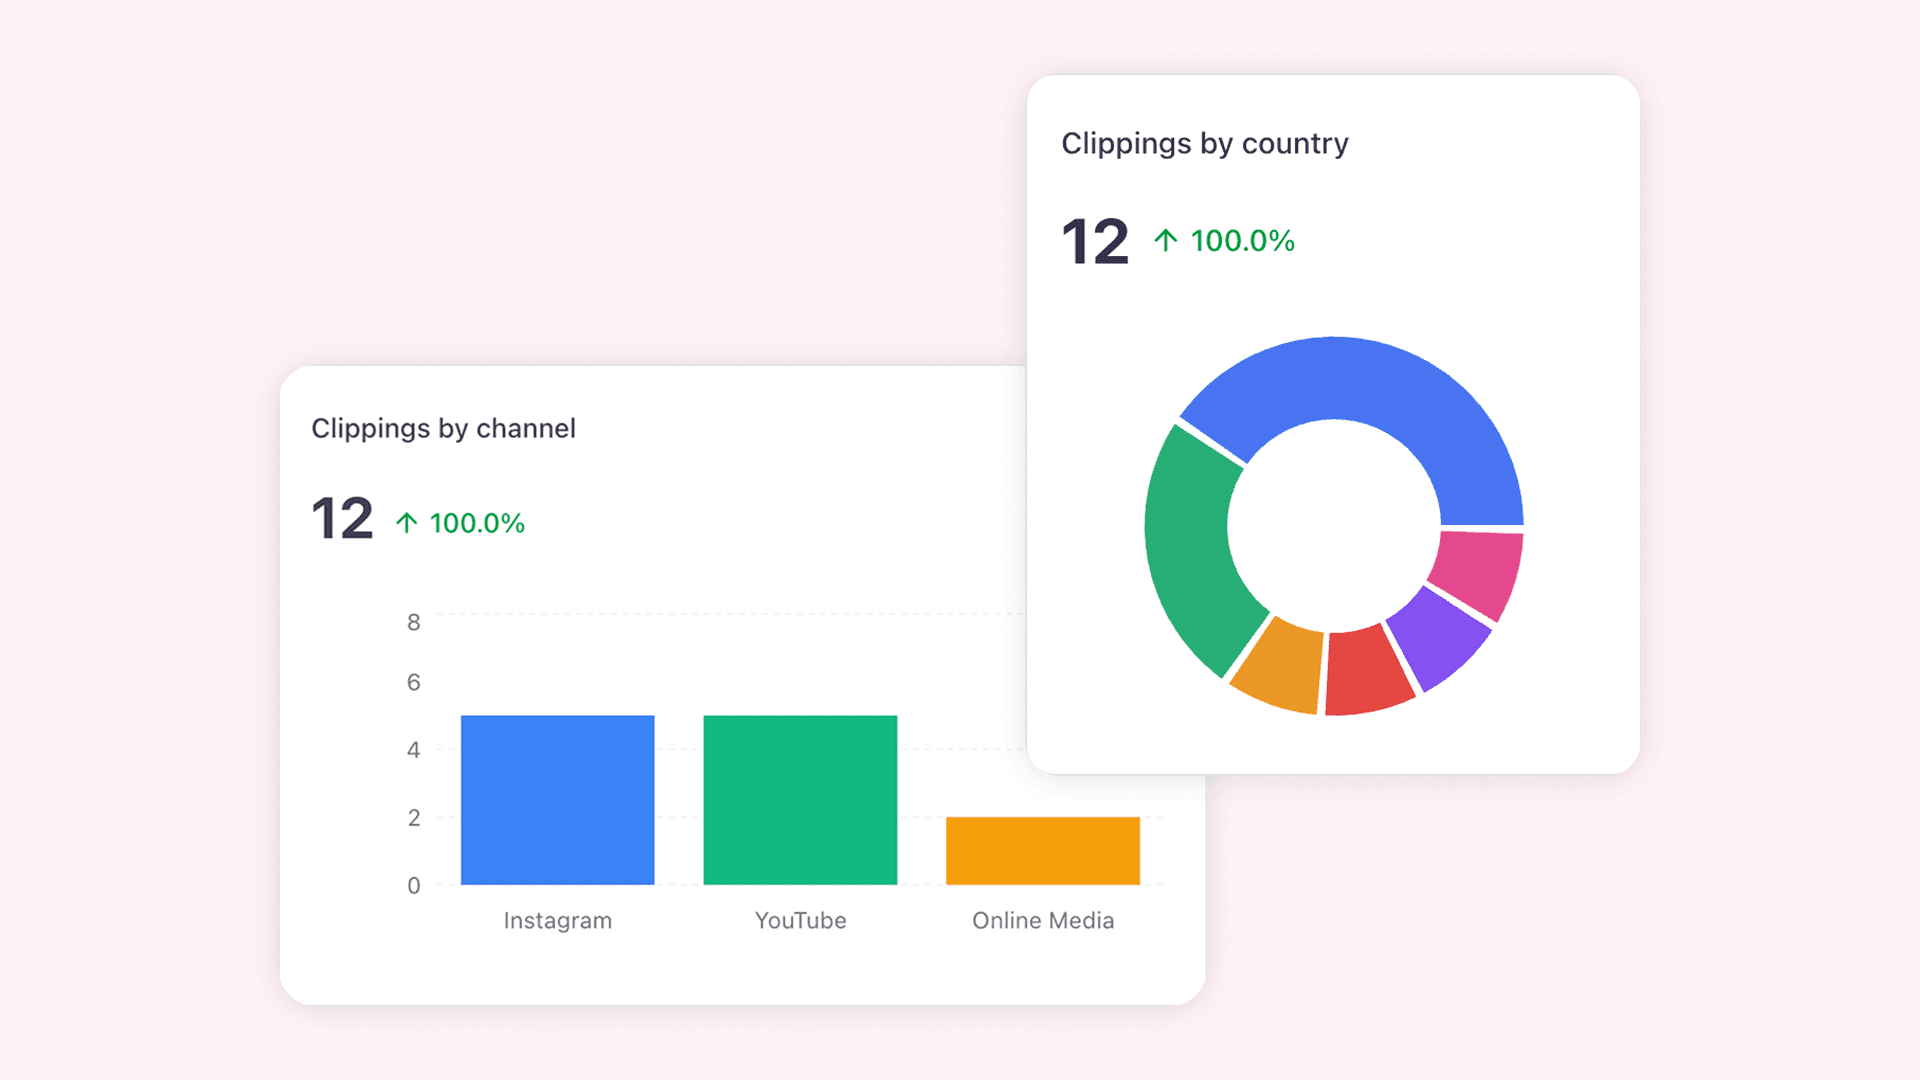
Follow reach, sentiment, channel mix, and campaigns.
Explore how a shared dashboard helps teams follow performance without rebuilding reports.
View example dashboard