The new table block
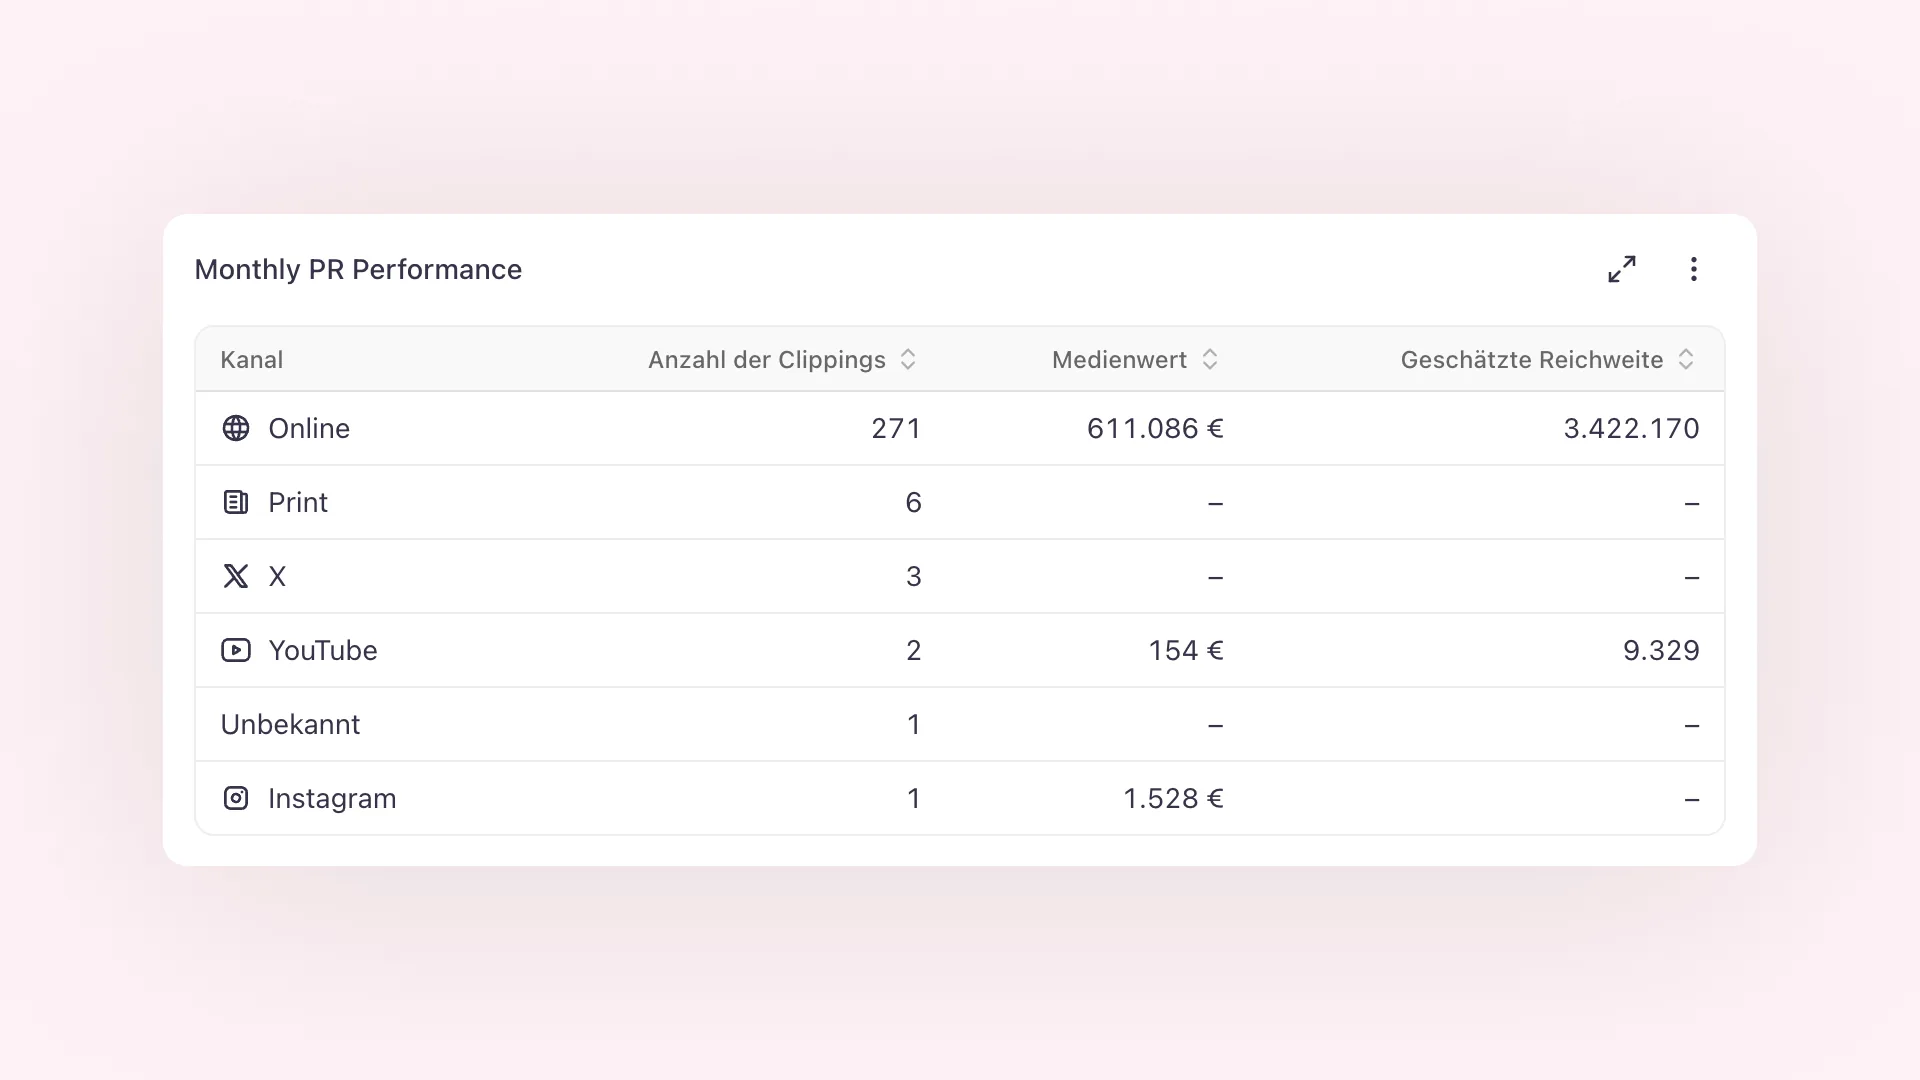

There is a new block for your dashboards and reports: the table.
Alongside KPIs and charts, you can now add a table that shows your data as rows and columns. List your clippings with their outlet, publication date, and country, or group them by outlet, country, channel, tag, or status to see the totals per group. Choose which metrics become columns, from media value and reach to your own custom metrics, and sort by any column with a click.
The table works with both data sources: your clippings and your AI Visibility data. With AI Visibility you can put your brand and competitors, or the different AI assistants, side by side and compare their visibility, share of voice, position, and sentiment in one view.
Like every other block, the table looks the same on the web, in public shared links, and in the exported PDF.