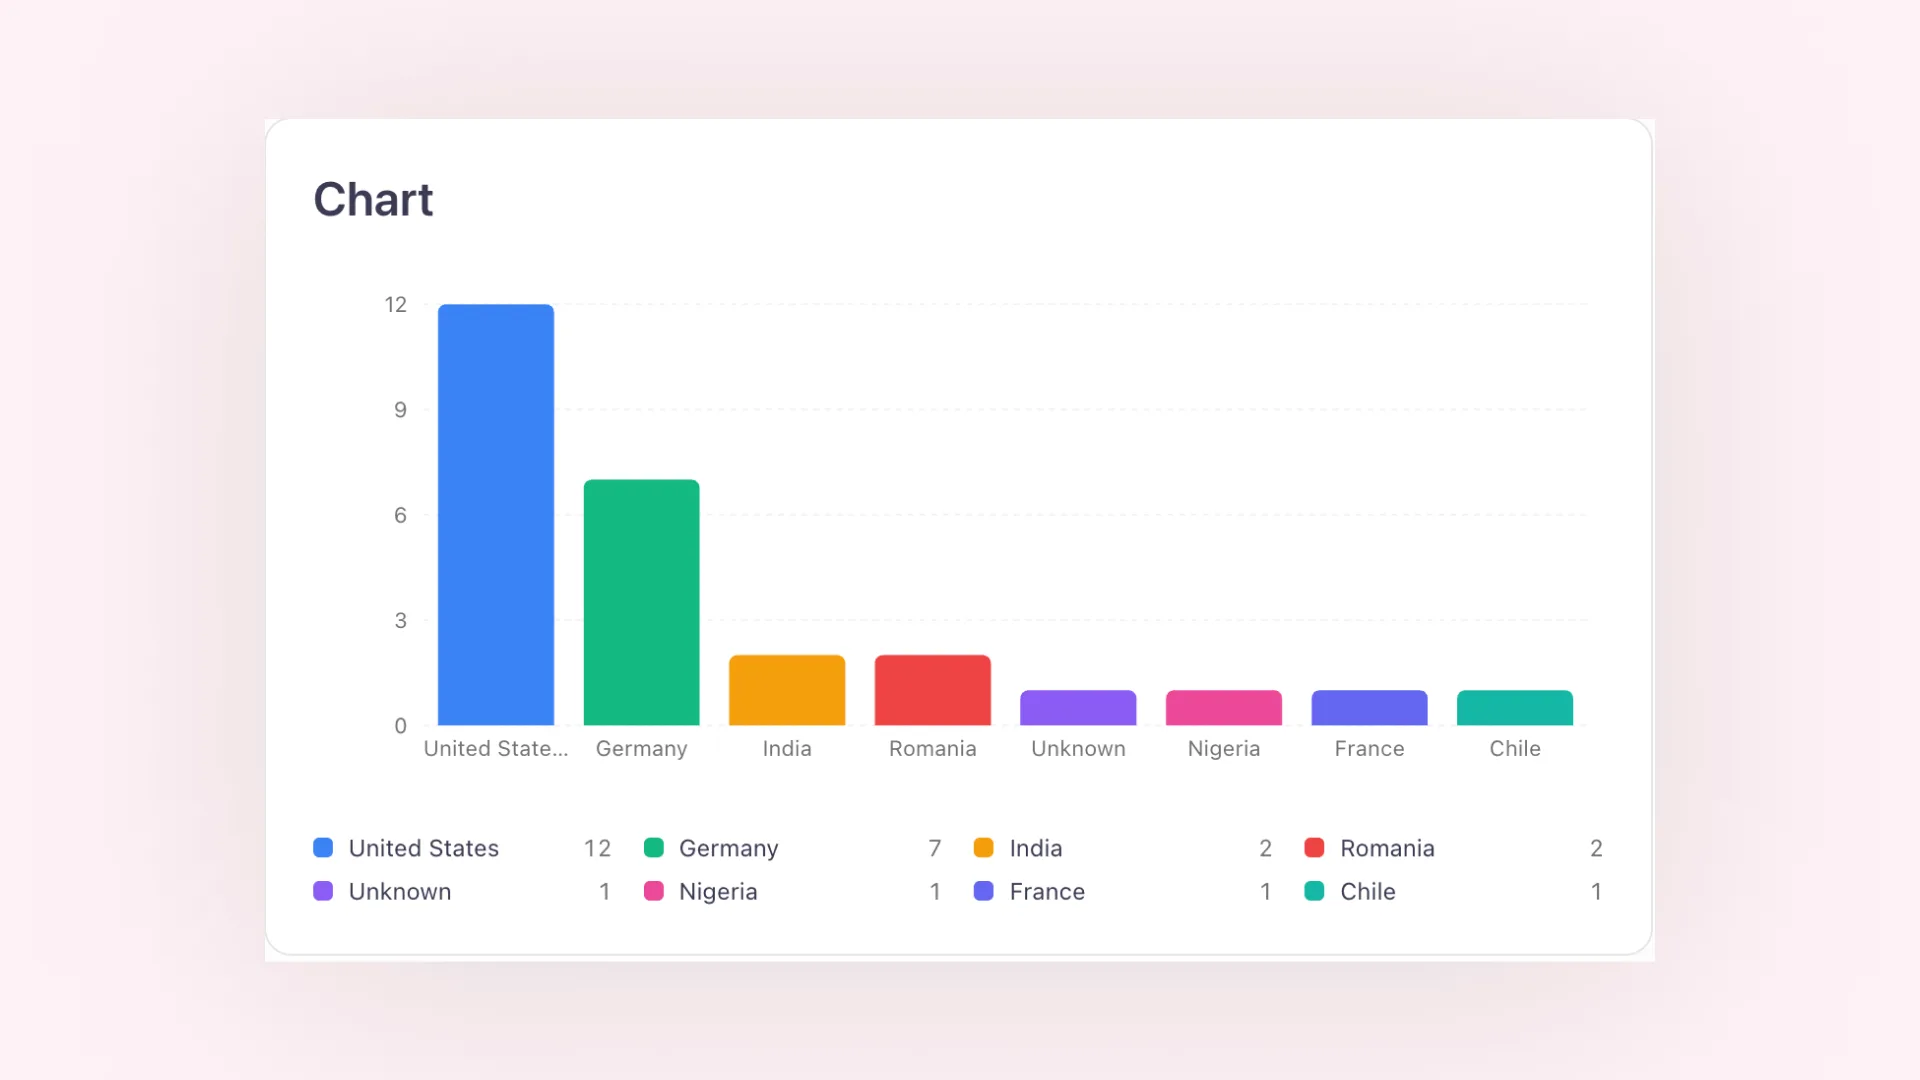
Charts for reports
Add charts to your reports to show your coverage and key metrics at a glance.
All the latest updates, improvements, and fixes to aclipp
Add charts to your reports to show your coverage and key metrics at a glance.
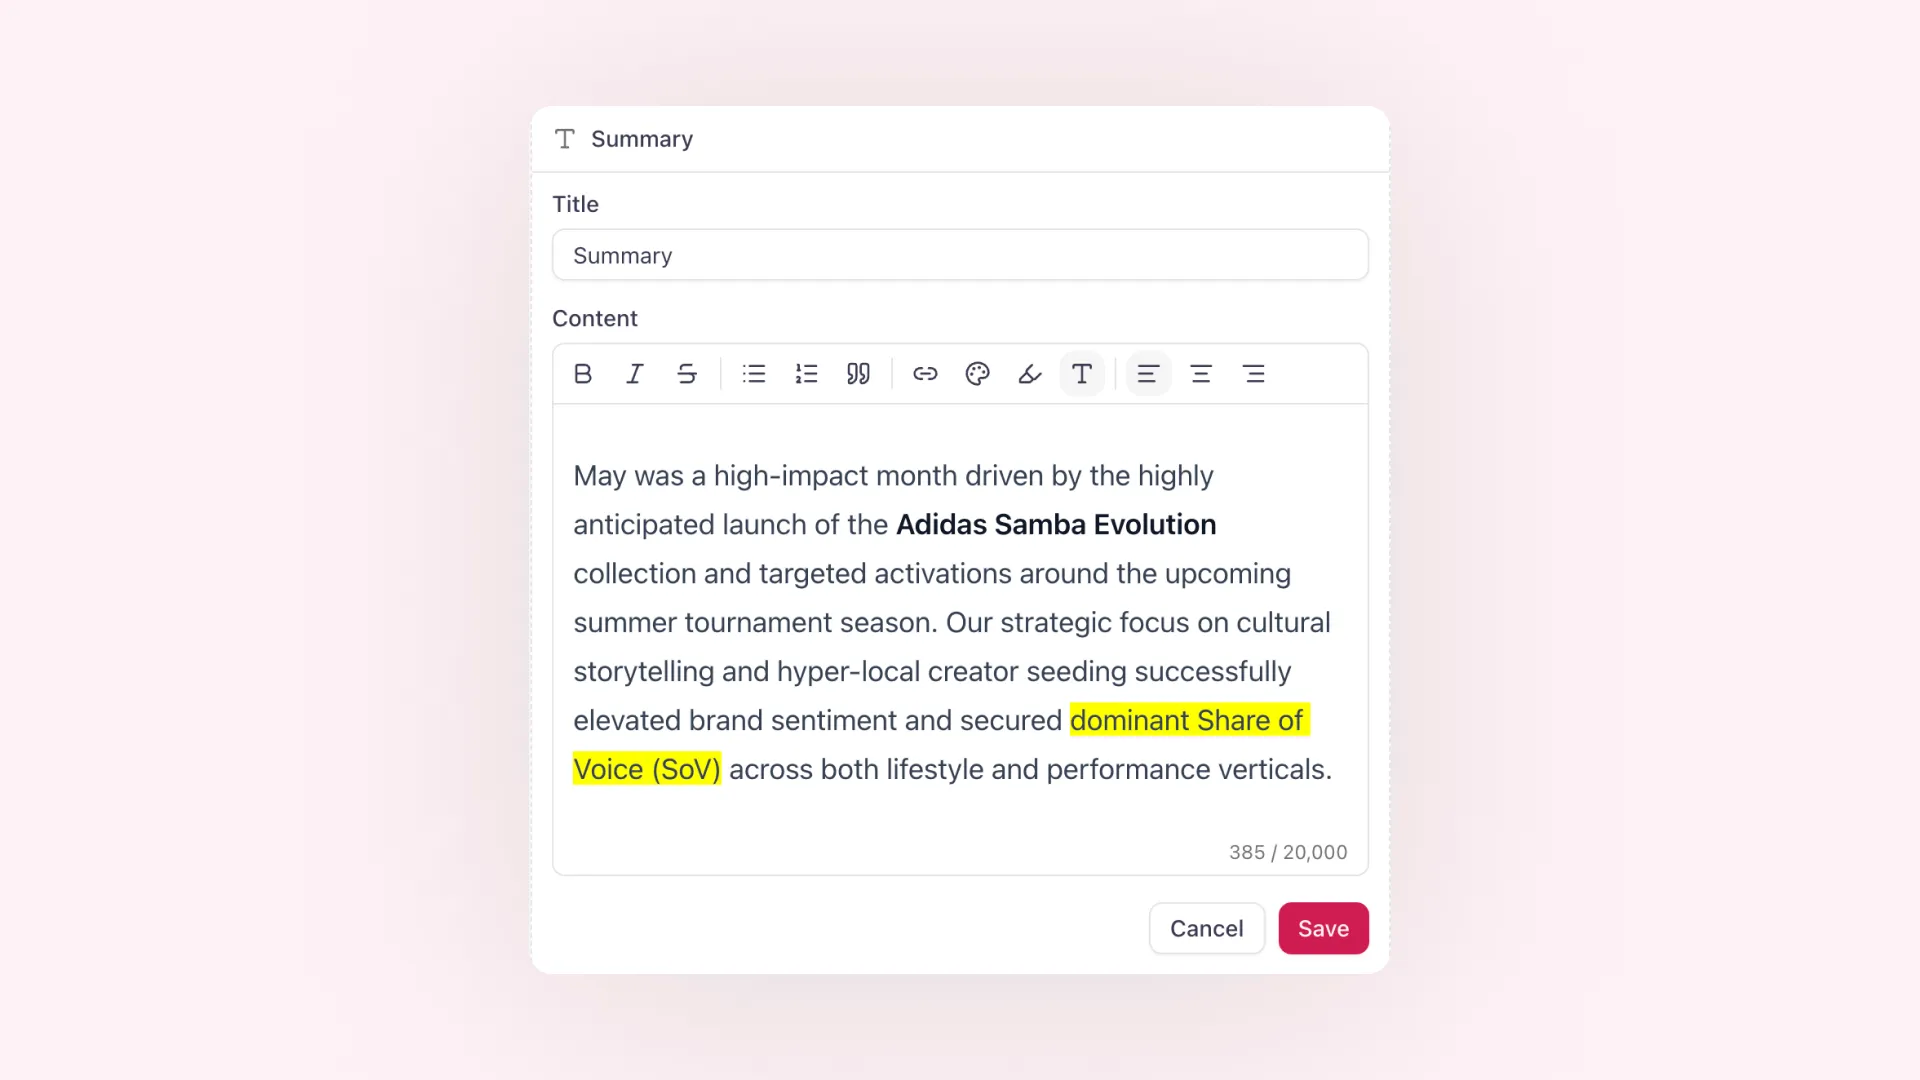
Add formatted commentary, explanations, and next steps directly to your report layout.
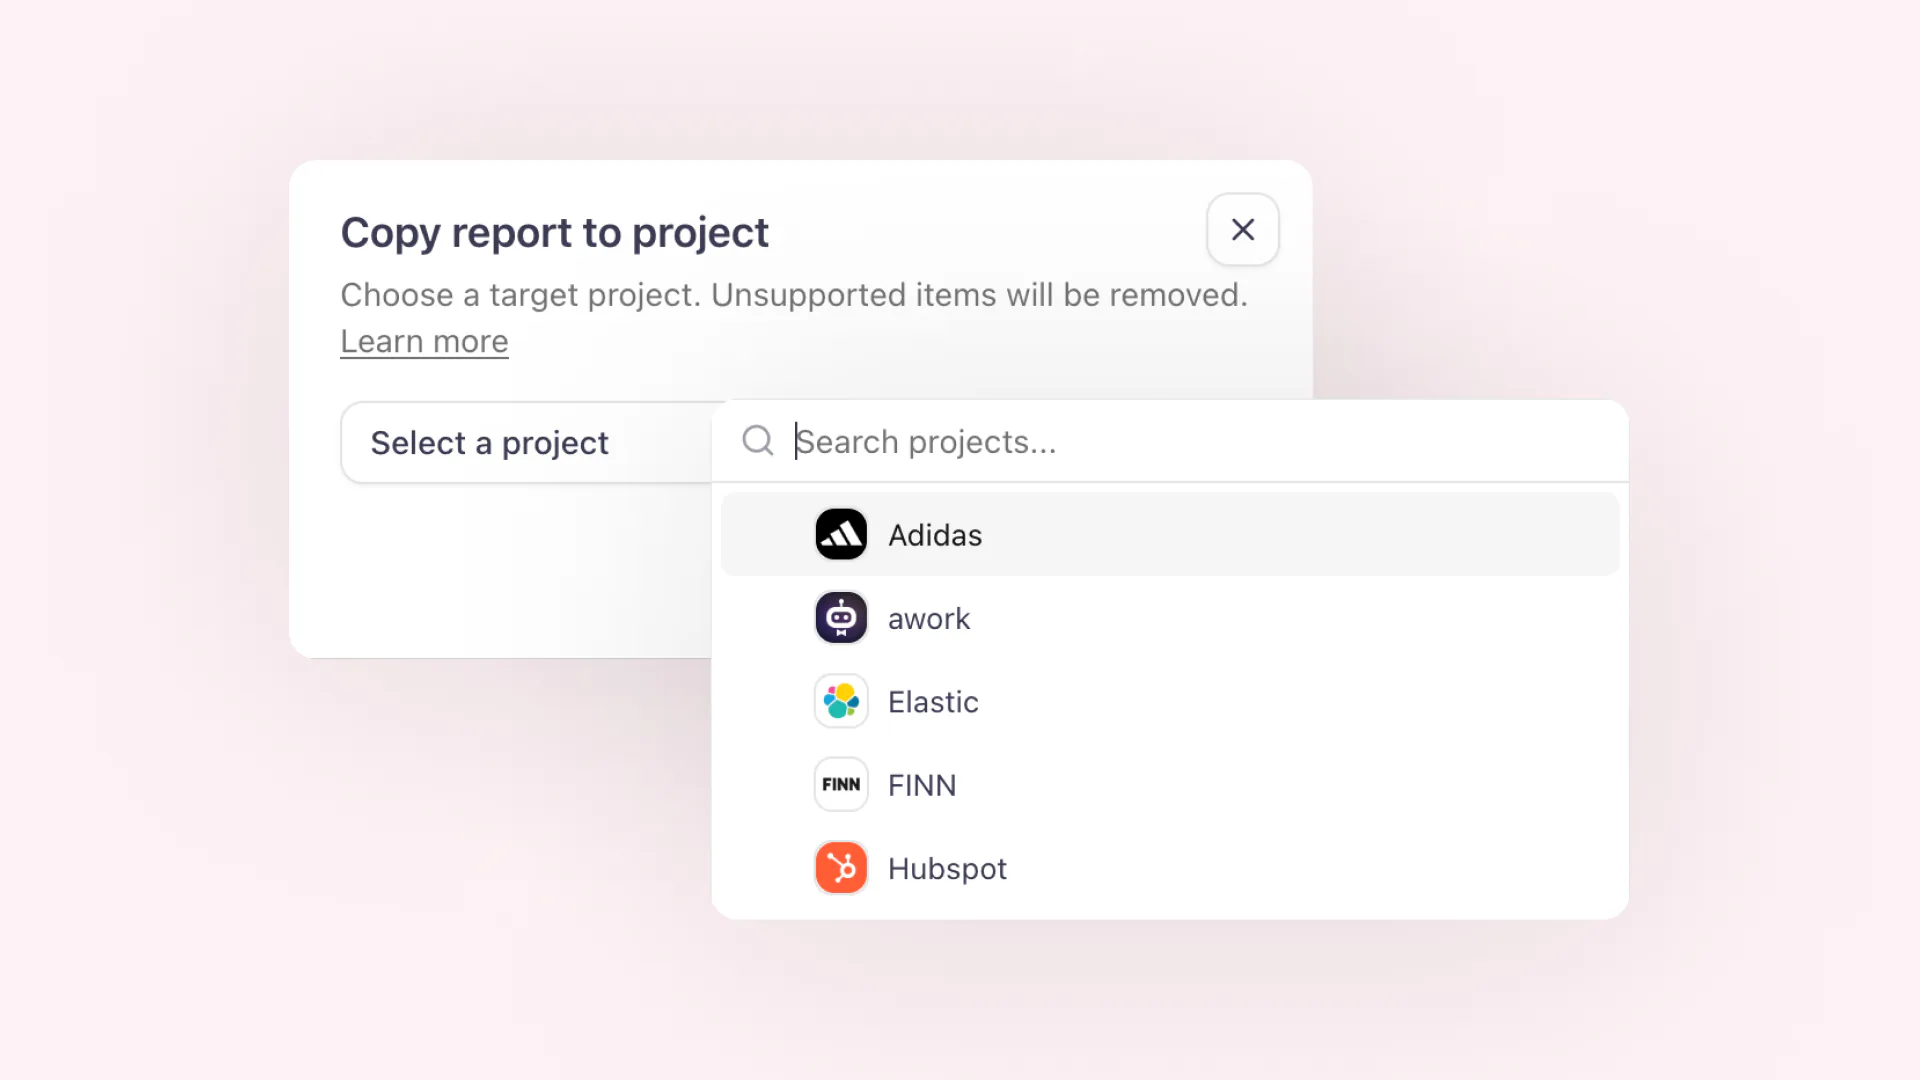
Reuse proven report layouts across clients, campaigns, and recurring reporting workflows.

Track how your brand appears in Google AI Mode and Google AI Overview alongside your other AI visibility providers.
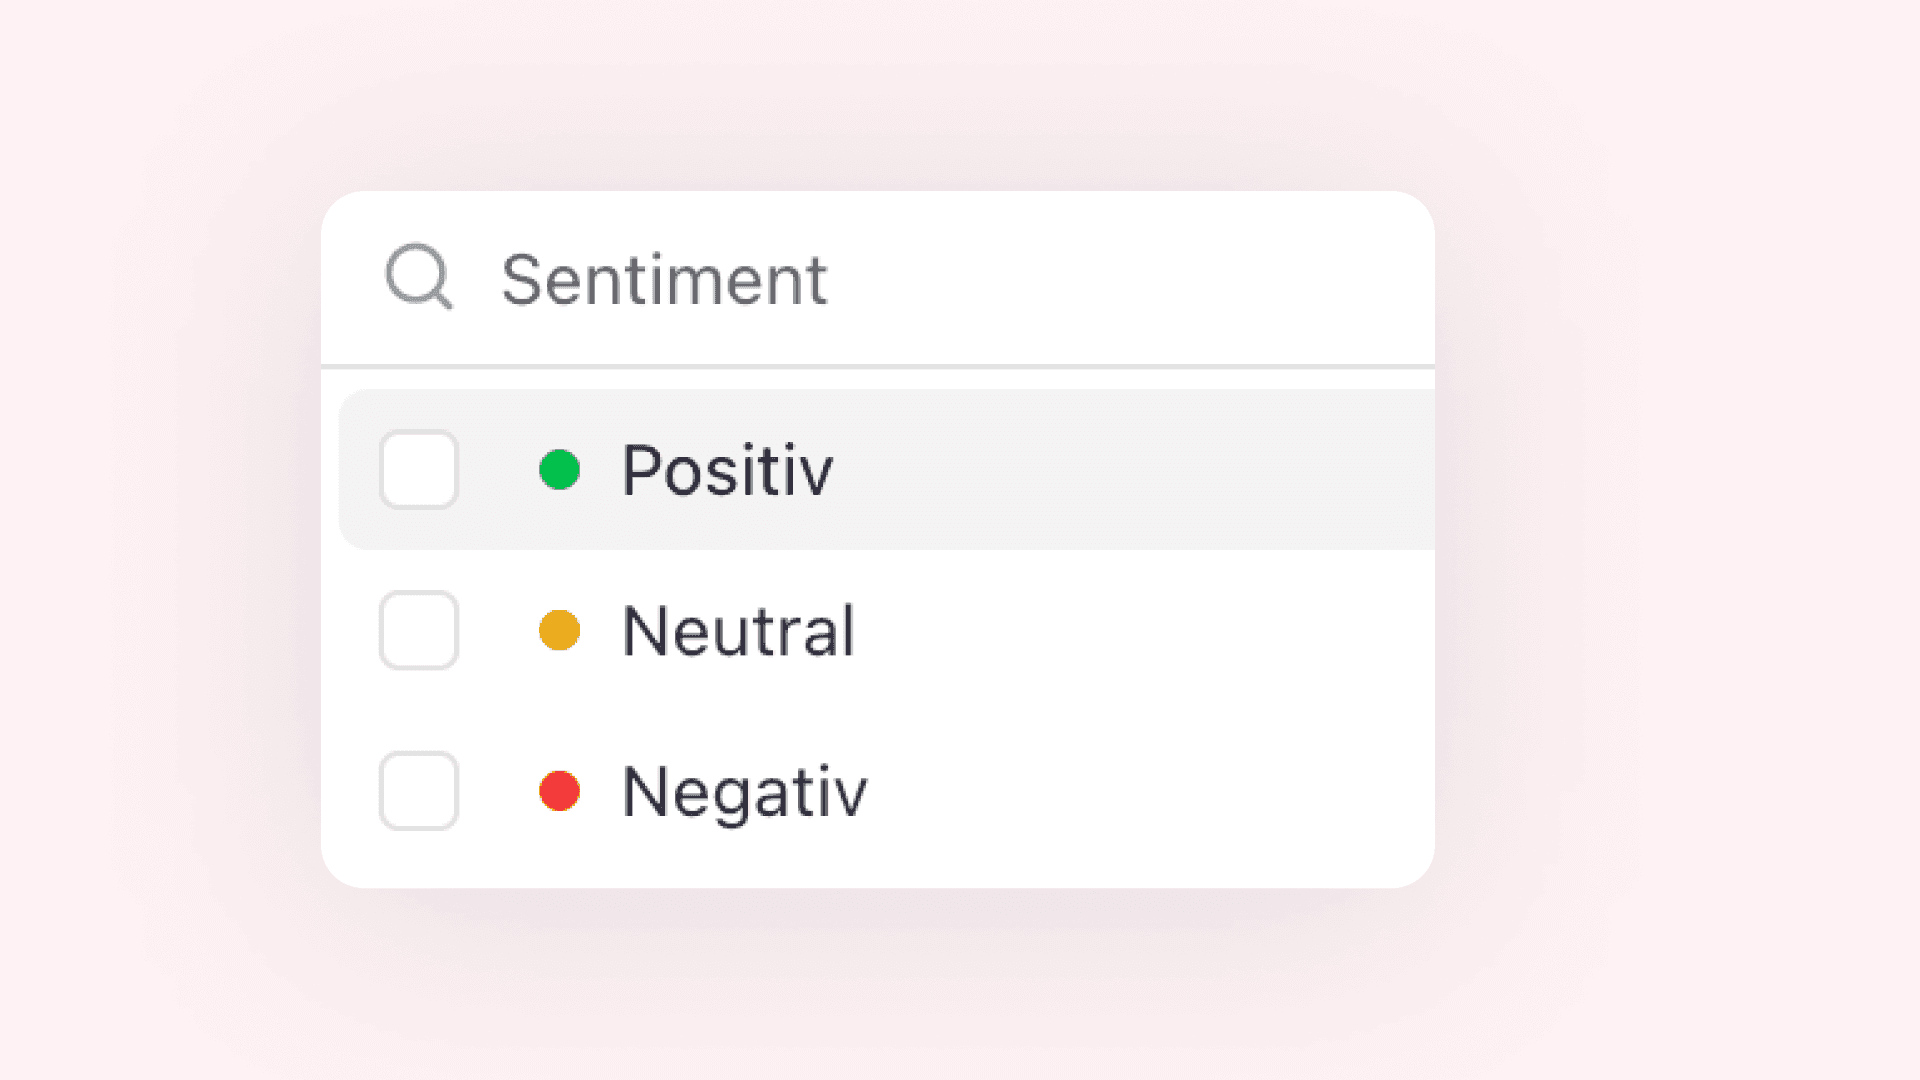
Track whether coverage is positive, neutral, or negative directly on each clipping.
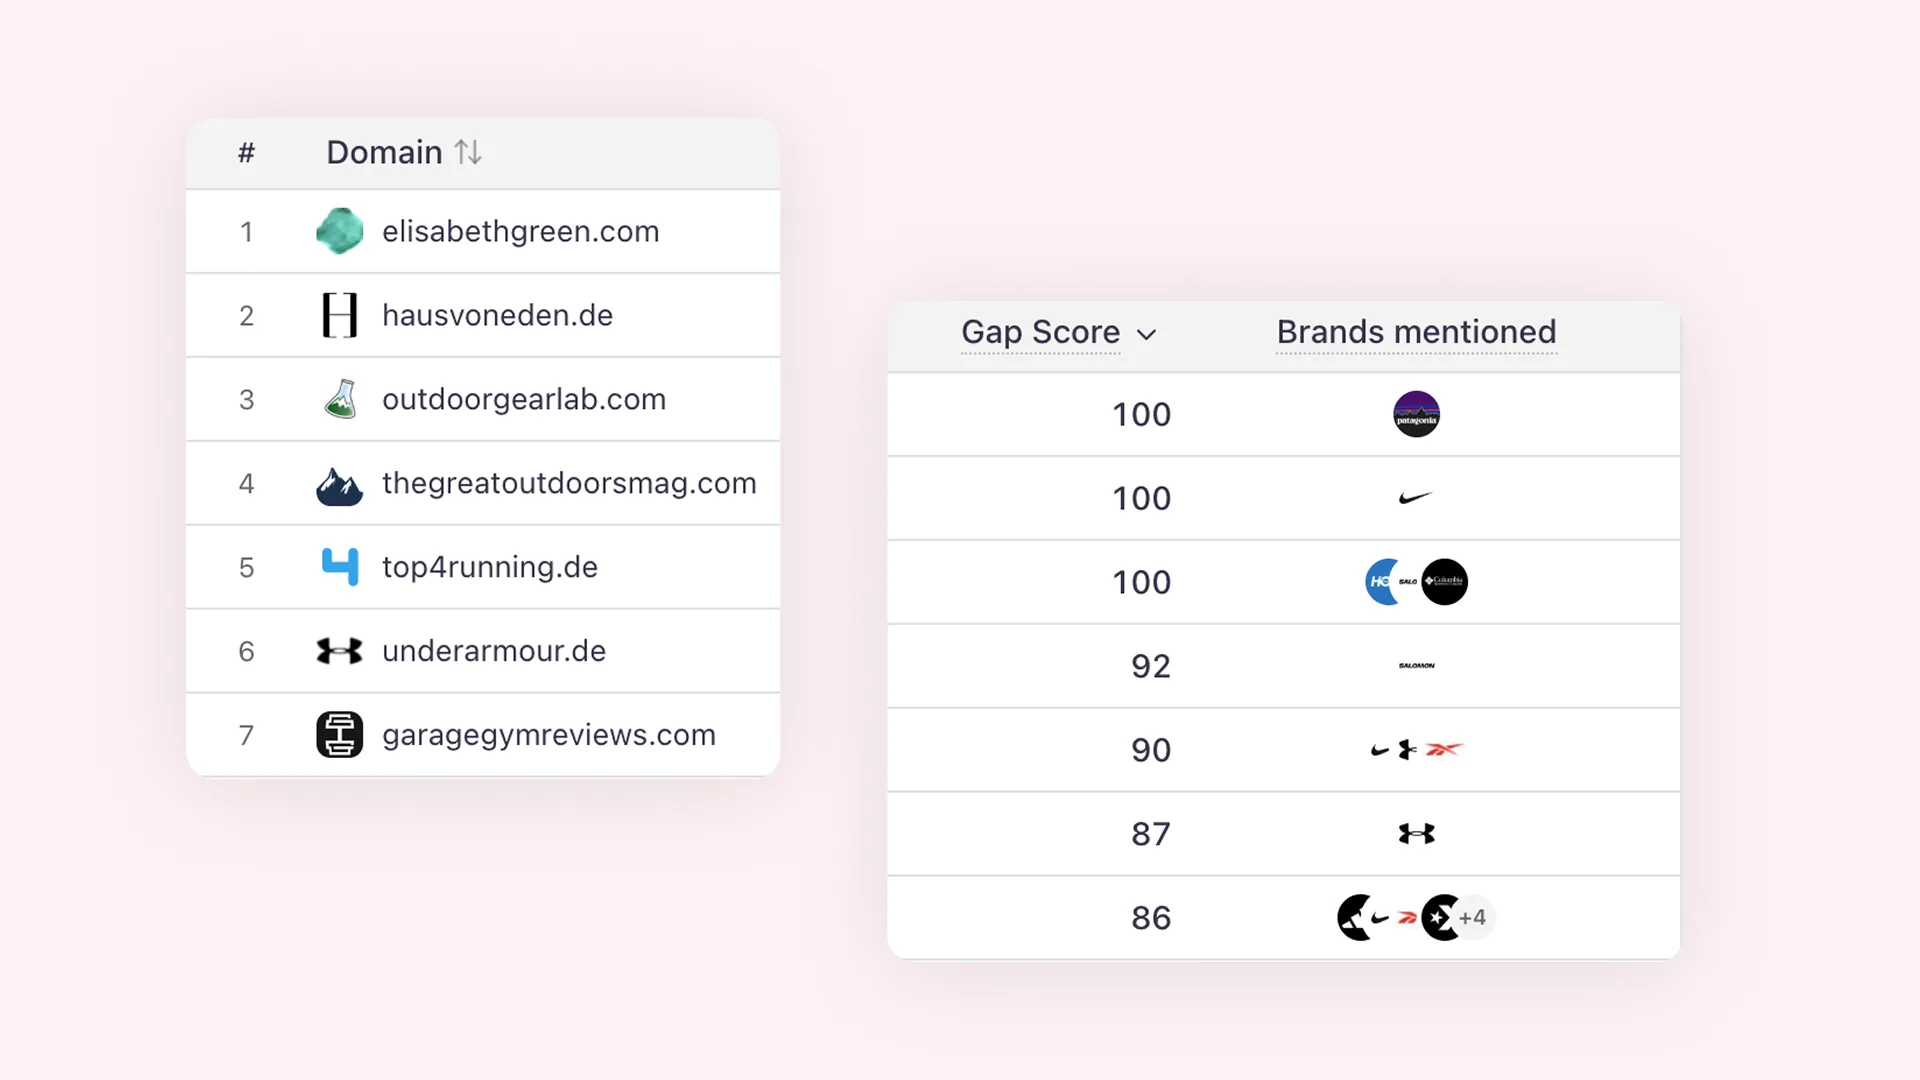
See where competitors are winning in AI answers and where your brand has the clearest room to improve.
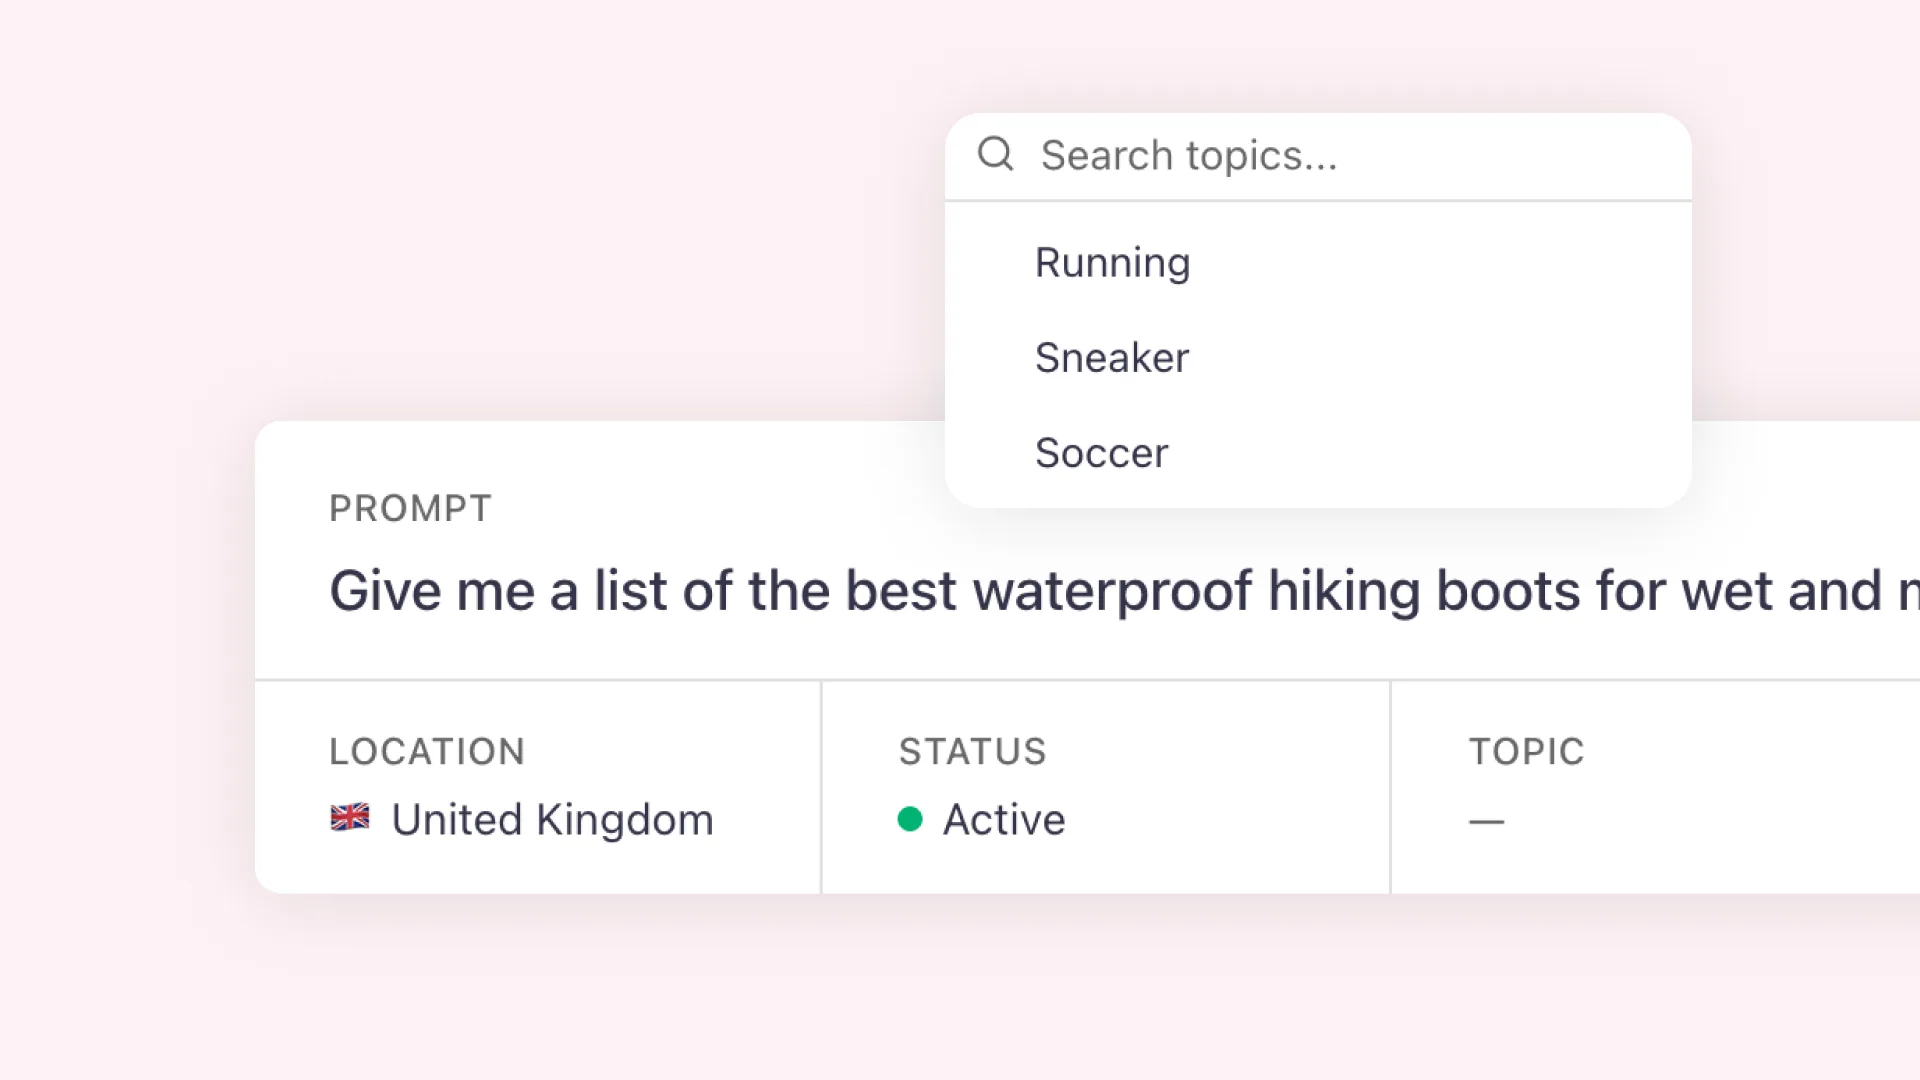
Group related prompts into topics and analyze AI visibility by theme, not just one prompt at a time.
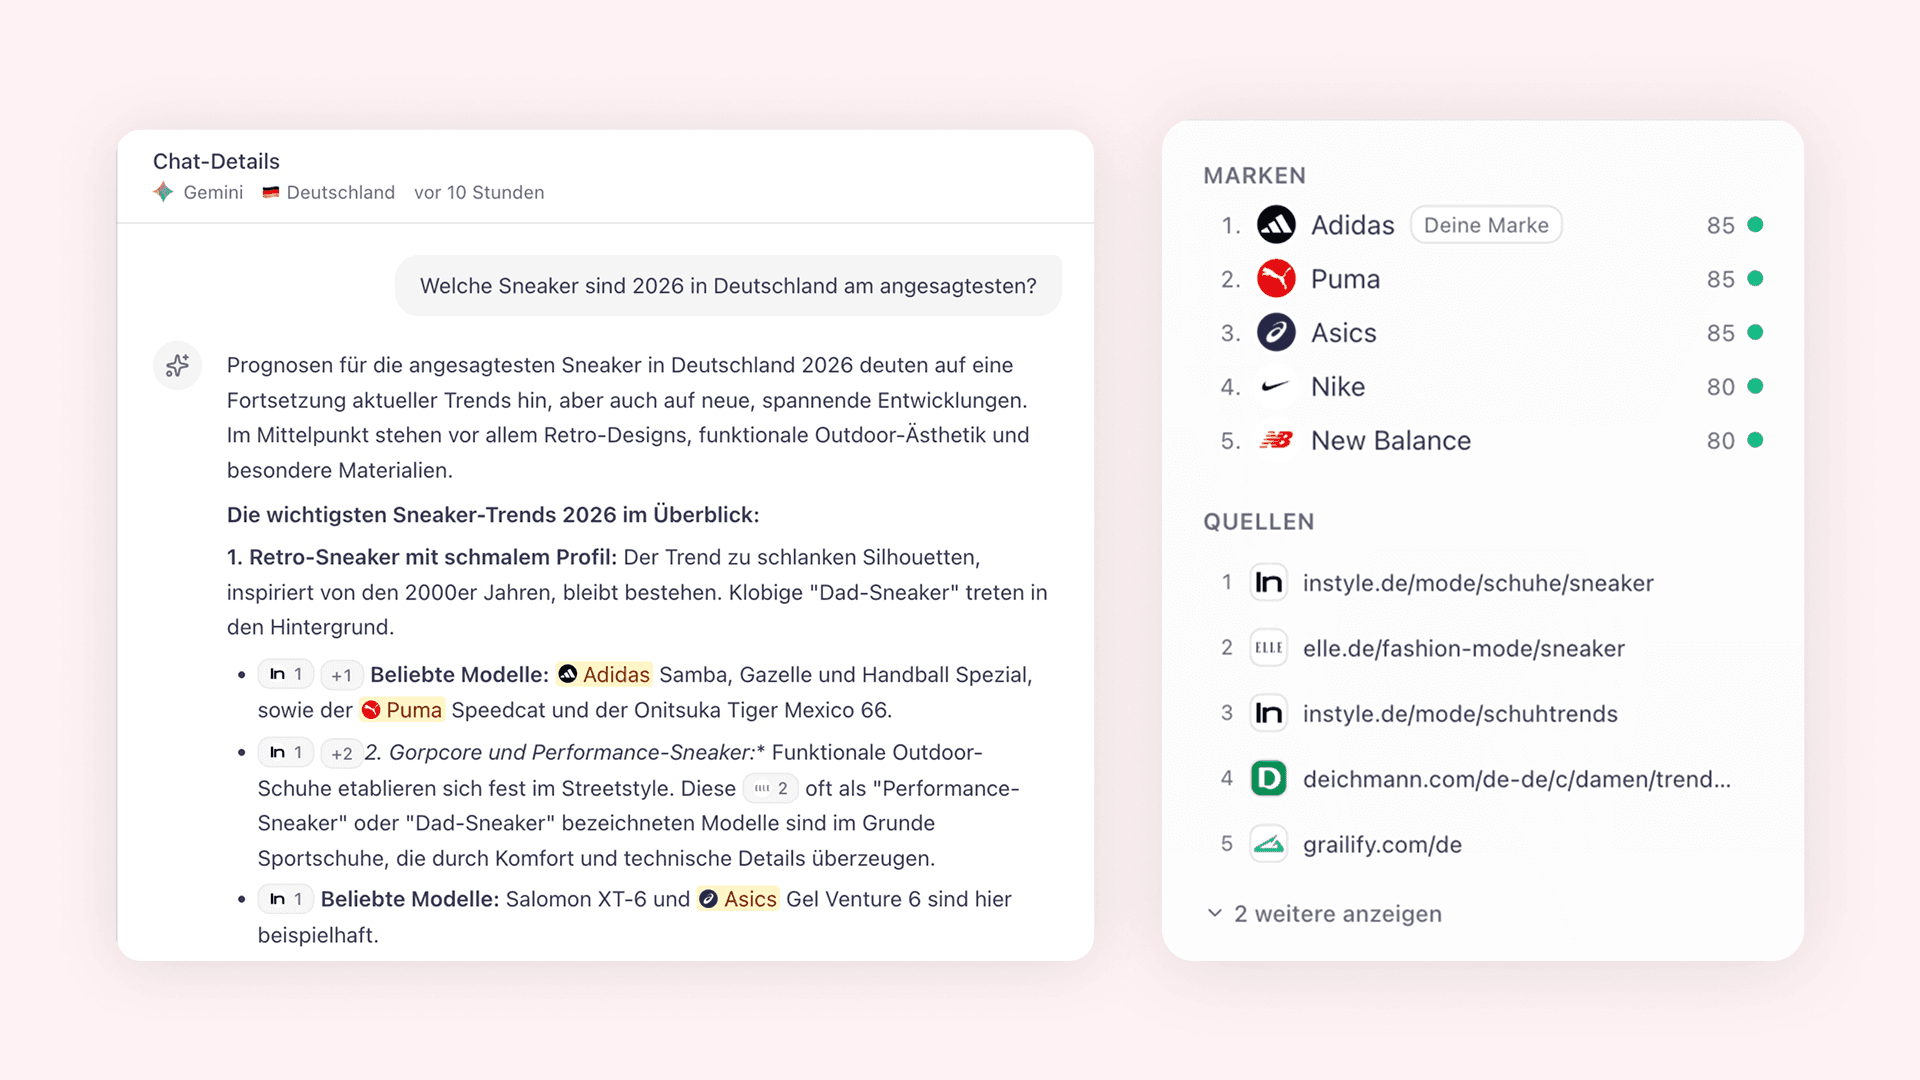
Track how ChatGPT, Gemini, Claude, Perplexity, and Grok talk about your brand.
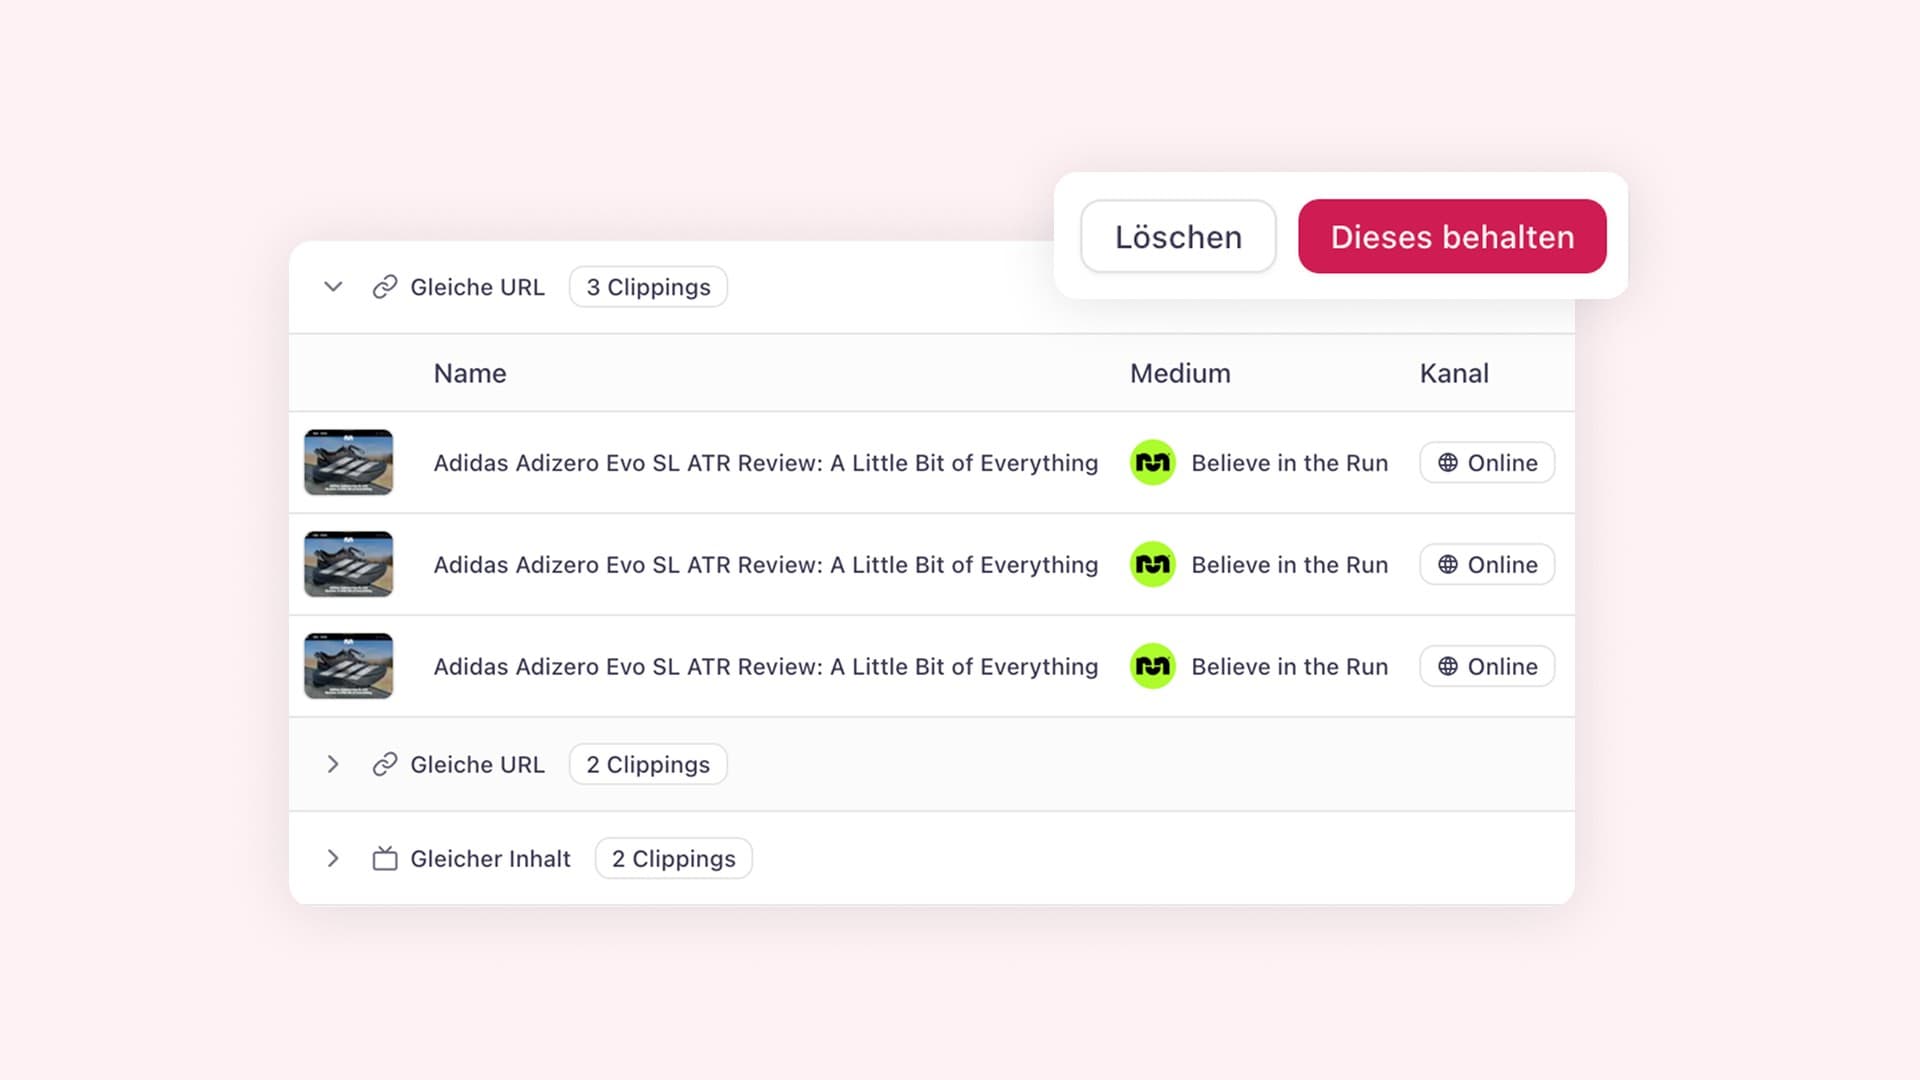
aclipp automatically detects duplicates across your project. Now with a dedicated page to review them and a new way to dismiss false matches.
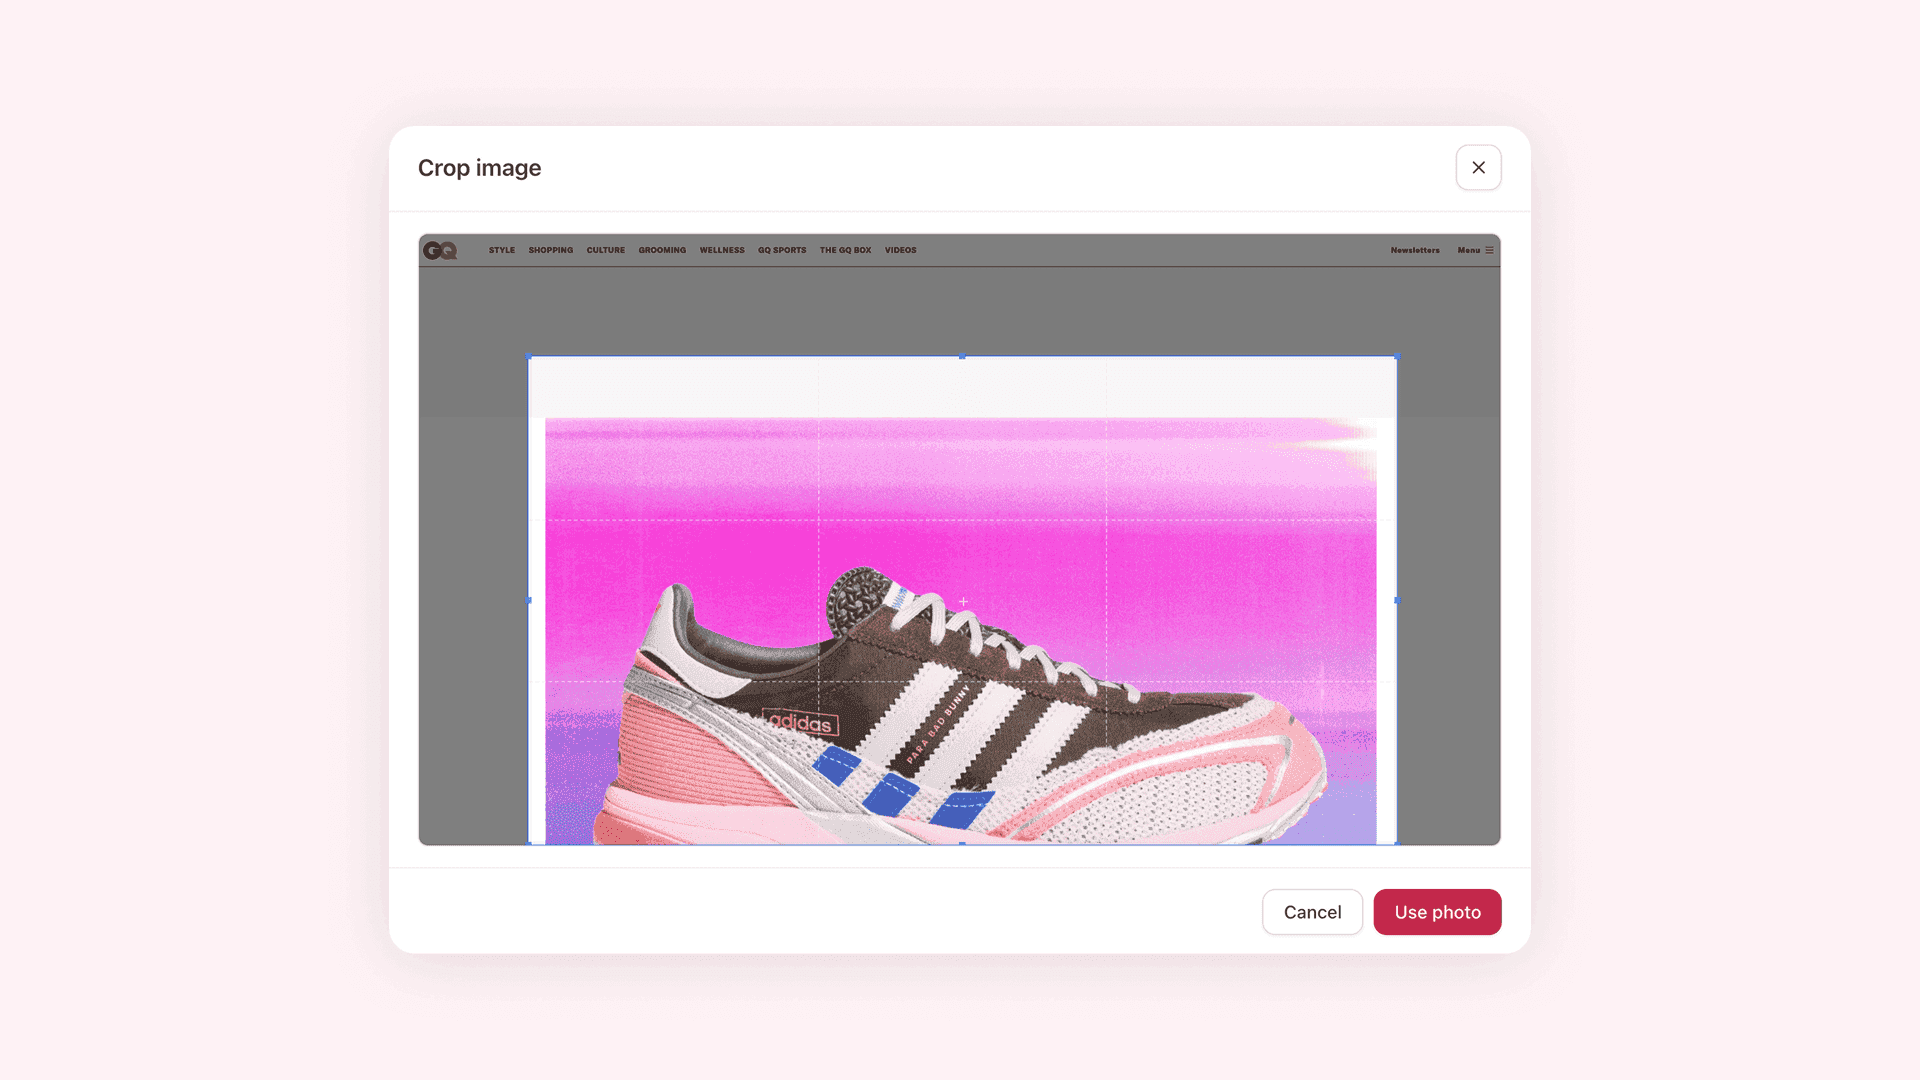
Trim clipping images to the relevant section without leaving the app.
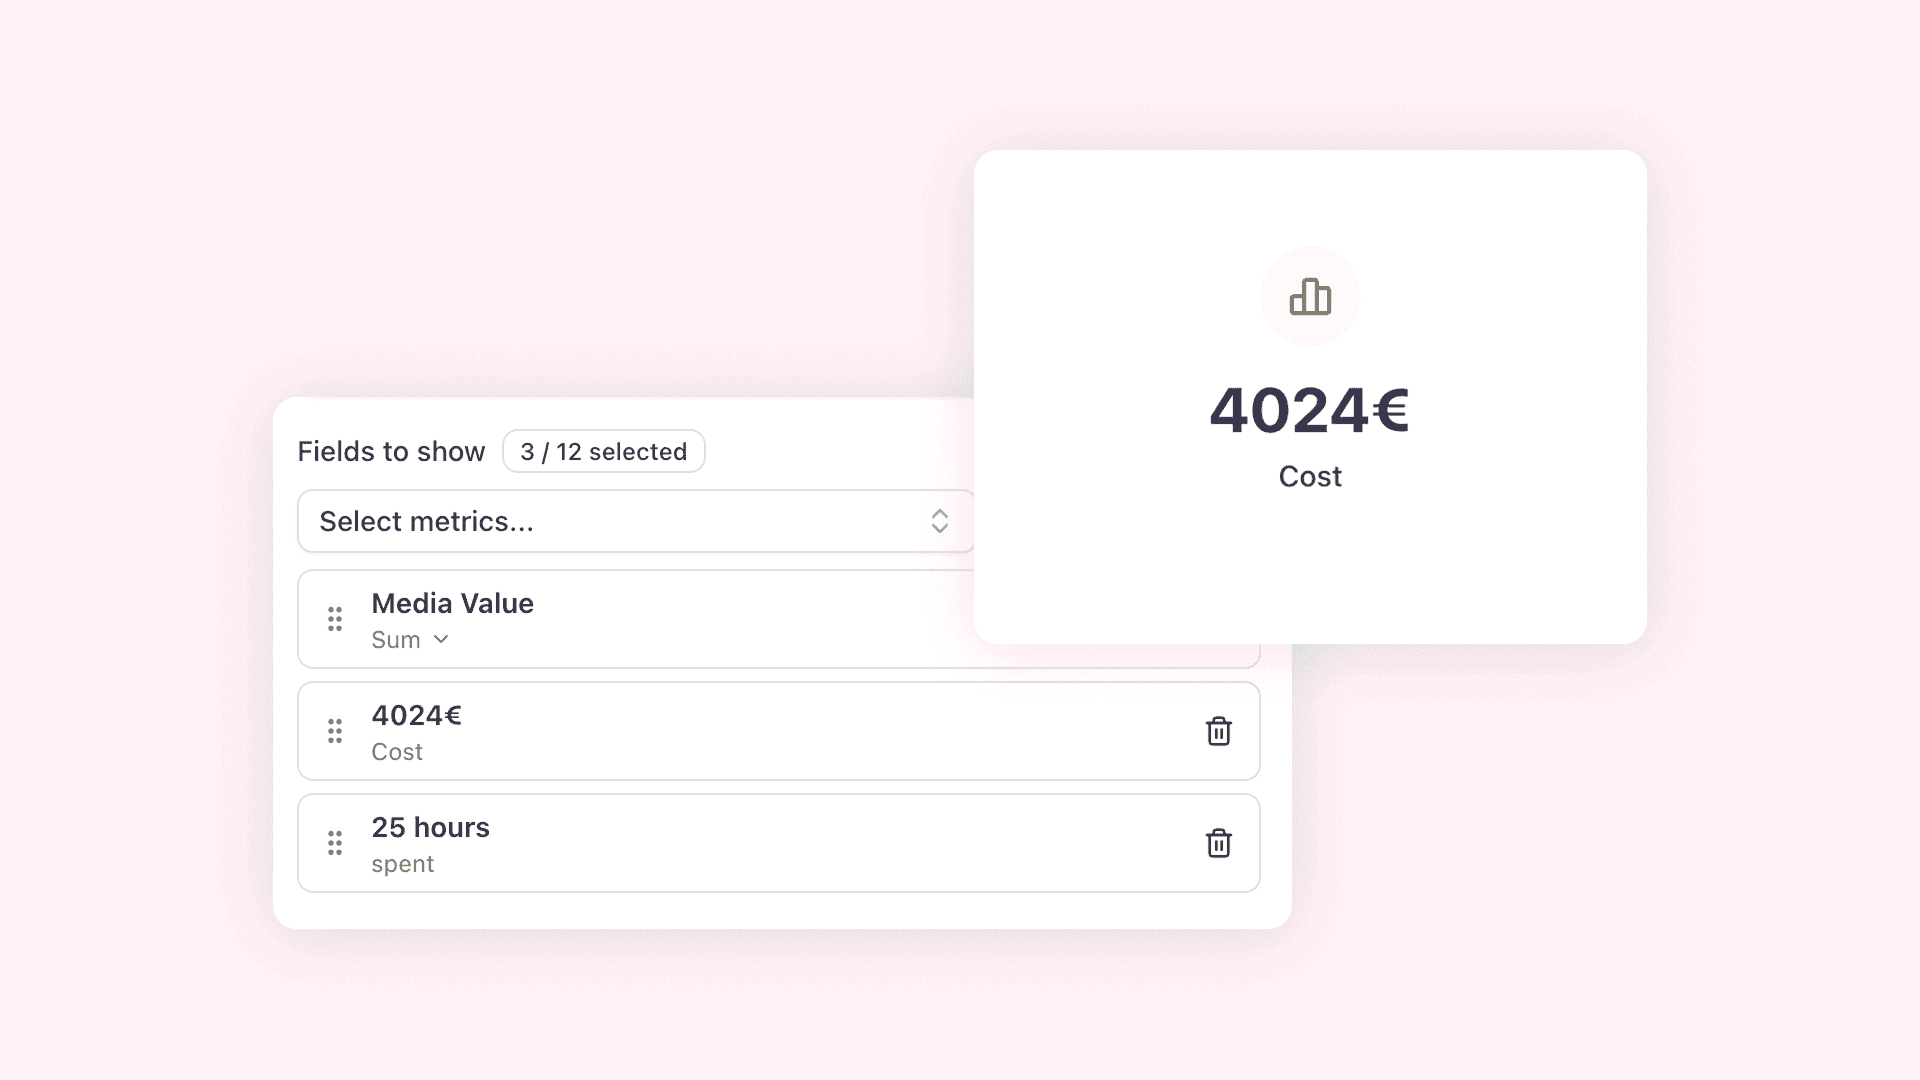
The summary block now supports custom entries alongside metrics, so you can add any label and value you need to contextualize your reports.
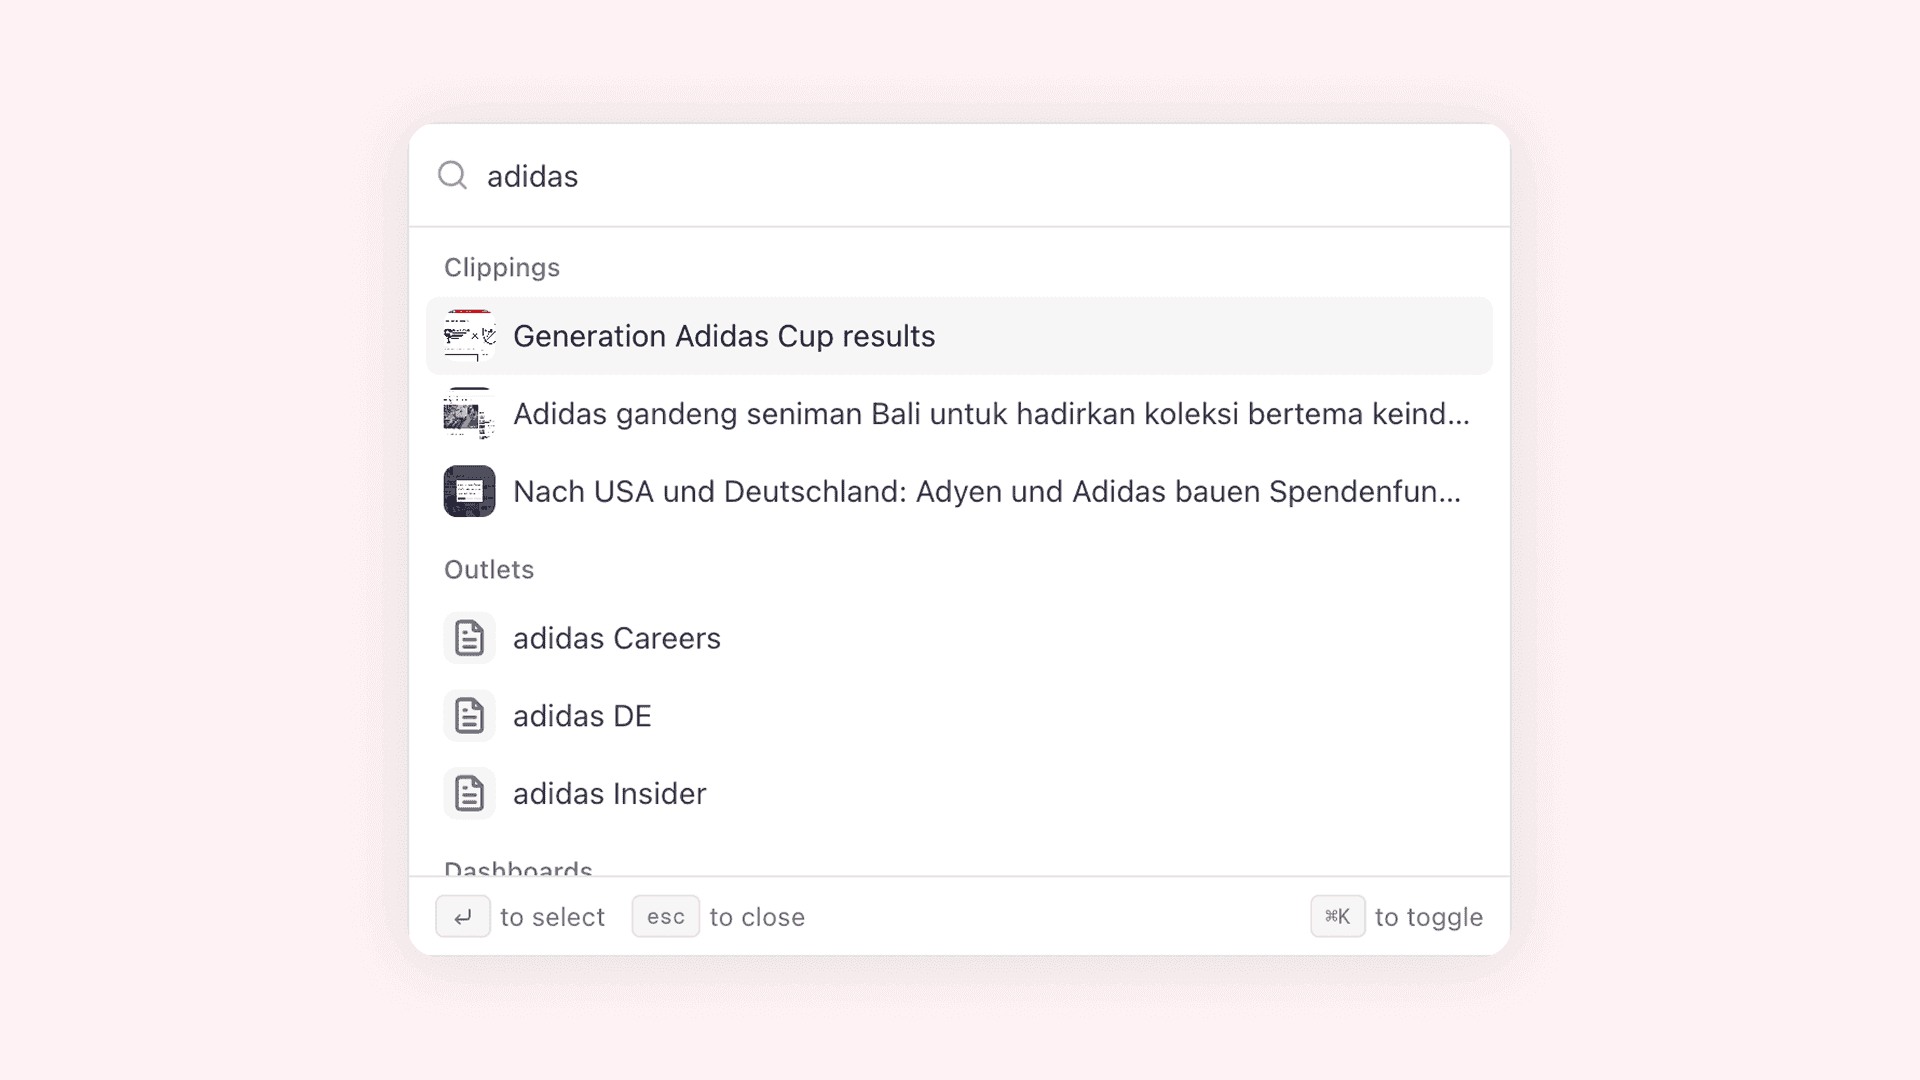
Jump to any page, clipping, or action in seconds with the new keyboard-driven quick access bar.